This set of Class 8 Maths Chapter 5 Multiple Choice Questions & Answers (MCQs) focuses on “Data Handling – Drawing a Pie Chart”.
1. What is the total angle at the center of pie chart?
a) 360°
b) 320°
c) 180°
d) 90°
View Answer
Explanation: Pie chart is basically a circle. Total angle at the center of a circle is 360°. The central angle of the sectors will be a fraction of 360°.
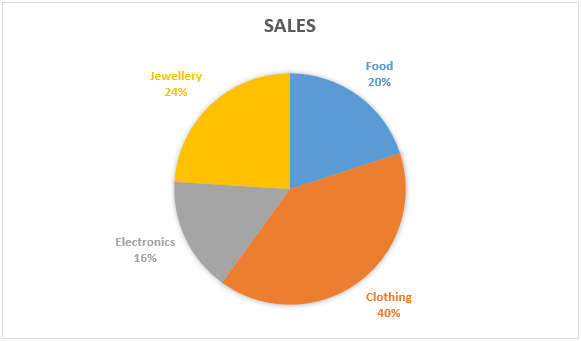
2. Below is the pie graph showing sales of different items in first quarter of the year.
Which item has the highest sales?
a) Food
b) Clothing
c) Electronics
d) Jewellery
View Answer
Explanation: Pie graph shows relation between whole and its parts. Sales of clothing is 40% of total sales of store. Sales of clothing is higher than sales of other three items.
3. Below is the pie graph showing sales of different items in first quarter of the year.
Which item has the lowest sales?
a) Food
b) Clothing
c) Electronics
d) Jewellery
View Answer
Explanation: Pie graph shows relation between whole and its parts. Sales of electronics is 16% of total sales of store. Sales of electronics is lower than sales of other three items.
4. Below is the pie graph showing sales of different items in first quarter of the year.
If total sales of company are Rs 600000, how much is the sales of food in Rs.?
a) 96000
b) 120000
c) 240000
d) 144000
View Answer
Explanation: Pie graph shows relation between whole and its parts. 20% of sales of company is from food department. Total sales of company is Rs. 600000. Thus, sales of food department is Rs. 120000.
5. Below is the pie graph showing sales of different items in first quarter of the year.
If total sales of company are Rs 1000000, how much is the sales of electronics in Rs.?
a) 160000
b) 200000
c) 400000
d) 240000
View Answer
Explanation: Pie graph shows relation between whole and its parts. 16% of sales of company is from electronics department. Total sales of company is Rs. 1000000. Thus, sales of electronics department is Rs. 160000.
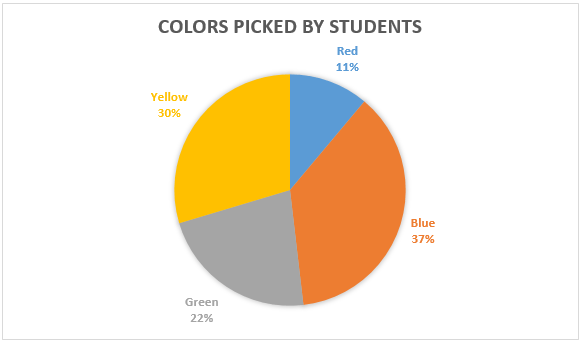
6. Below is the pie graph showing colors picked by students of a class.
22% of students picked which color?
a) Red
b) Blue
c) Green
d) Yellow
View Answer
Explanation: Pie graph shows relation between whole and its parts. According to the pie chart, 22% of students picked green color. 37% picked blue, 30% picked yellow and 11% picked red color.
7. Below is the pie graph showing colors picked by students of a class.
If total students of class are 200, how many students picked red color?
a) 11
b) 44
c) 22
d) 66
View Answer
Explanation: Pie graph shows relation between whole and its parts. According to the pie chart, 11% of students picked red color. Total number of students of a class is 200. Thus, number of students who picked red color is 22.
8. Below is the pie graph showing colors picked by students of a class.
Number of students who picked blue color are 111. How many students were there in that class?
a) 200
b) 300
c) 100
d) 400
View Answer
Explanation: Pie graph shows relation between whole and its parts. According to the pie chart, 37% of students picked blue color. Total number of students who picked blue color is 111. Thus, total number of students of that class is 300.
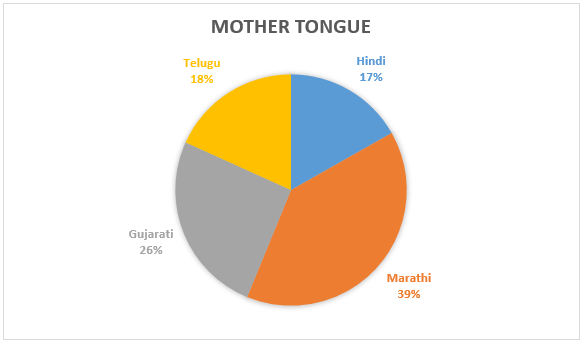
9. Below is the pie graph showing mother tongue of people in a society.
What percent of people in society speak Hindi?
a) 18%
b) 17%
c) 26%
d) 39%
View Answer
Explanation: Pie graph shows relation between whole and its parts. According to the pie chart, 17% of people in the society speak hindi as their mother tongue.
10. Below is the pie graph showing mother tongue of people in a society.
Total number of people in society is 1500. How many people speak Marathi?
a) 255
b) 270
c) 390
d) 585
View Answer
Explanation: Pie graph shows relation between whole and its parts. According to the pie chart, 39% of people in the society speak marathi as their mother tongue. Total number of people in the society is 1500. Thus, 585 people speak marathi as their mother tongue in the society.
Sanfoundry Global Education & Learning Series – Mathematics – Class 8.
To practice all chapters and topics of class 8 Mathematics, here is complete set of 1000+ Multiple Choice Questions and Answers.
If you find a mistake in question / option / answer, kindly take a screenshot and email to [email protected]
- Practice Class 10 Mathematics MCQs
- Practice Class 9 Mathematics MCQs
- Check Class 8 - Mathematics Books
