This set of Data Interpretation Questions and Answers (MCQs) focuses on “Pie Chart”. These questions are beneficial for various competitive exams, placement interviews, and entrance tests.
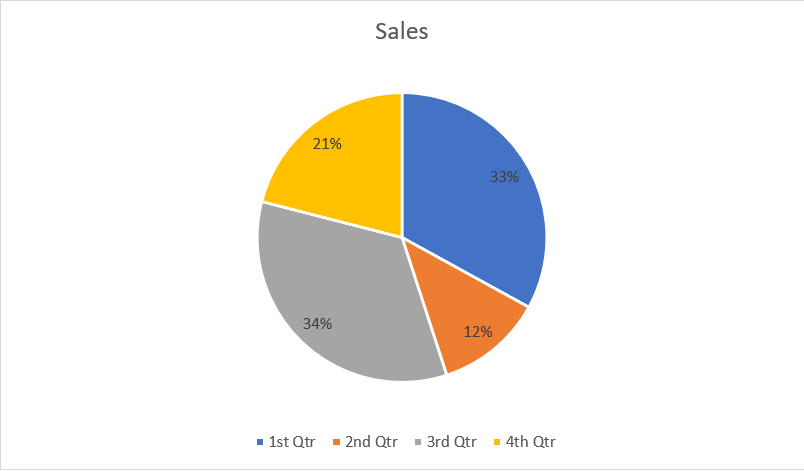
1. The total sales throughout the year was 2625 units, study the graph and find the sales in 2nd quarter.
a) 315 units
b) 485 units
c) 195 units
d) 120 units
View Answer
Explanation: The sales in 2nd quarter = 12 / 100 * 2625 = 315 units.
2. The yearly sales were 2,36,250 units, study the graph and find the sales in 3rd quarter.
a) 80325 units
b) 83025 units
c) 83265 units
d) 86250 units
View Answer
Explanation: The sales during the 3rd quarter = 236250 * 34 / 100 = 80325 units.
3. Study the graph and find the angle of the sector of the 3rd quarter.
a) 124.2 degrees
b) 122.4 degrees
c) 142.4 degrees
d) 142.2 degrees
View Answer
Explanation: The angle of the sector of the 3rd quarter = 34 / 100 * 360 = 122.4 degrees.
4. Study the graph and find the angle of the sector of the 4th quarter.
a) 74.5 degrees
b) 75.6 degrees
c) 76.5 degrees
d) 75.4 degrees
View Answer
Explanation: The angle of the sector of the 4th quarter = 21 / 100 * 360 = 75.6 degrees.
5. Study the graph and find what is the angle of the sector of the 1st sector?
a) 120 degrees
b) 118.8 degrees
c) 118.18 degrees
d) 118.88 degrees
View Answer
Explanation: The angle of the sector of the 1st quarter = 33 / 100 * 360 = 118.8 degrees.
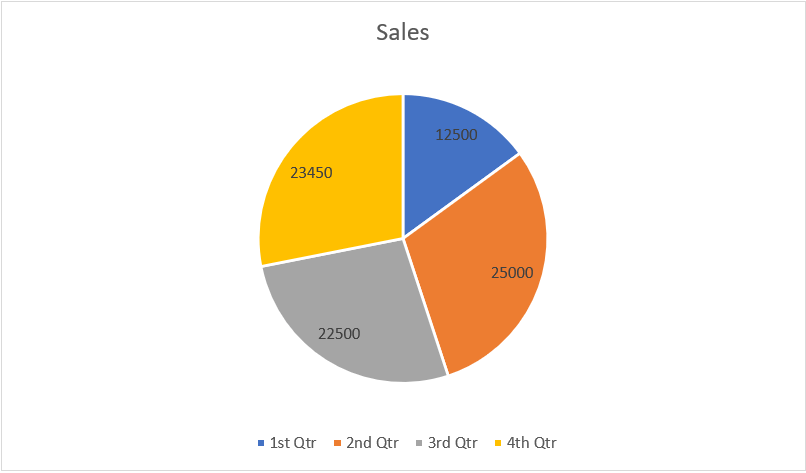
6. Study the graph and find what is the percentage sales of 1st quarter compared to the entire year?
a) 14.5%
b) 15%
c) 15.5%
d) 16%
View Answer
Explanation: The sales in the 1st quarter = 12500 units
The sales throughout the year = 12500 + 22500 + 25000 + 23450 = 83450
The required percentage = 12500 / 83450 * 100 = 14.97% ≈ 15%
7. Study the graph and find what is the angle of sector of the 3rd quarter?
a) 94 degrees
b) 97 degrees
c) 99 degrees
d) 102 degrees
View Answer
Explanation: The angle of the sector of the third quarter = 22500 / 83450 * 360 = 97.06 degrees ≈ 97 degrees.
8. Study the graph and find what is the average monthly sales throughout the year?
a) 6945.19 units
b) 6954.19 units
c) 6954.16 units
d) 6945.16 units
View Answer
Explanation: The average monthly sales throughout the year = (12500 + 22500 + 23450 + 25000) / 12 = 83450 / 12 = 6954.16 units per month.
9. Study the graph and find what is the average quarterly sales throughout the year?
a) 20862.5 units
b) 20682.5 units
c) 20628.5 units
d) 20826.5 units
View Answer
Explanation: The average quarterly sales = (12500 + 22500 + 25000 + 23450) / 4 = 83450 / 4 = 20862.5 units quarterly.
10. The sales in 1st quarter is to study the graph and find what percentage of the sales in the 3rd quarter?
a) 44.44%
b) 55.55%
c) 66.66%
d) 54.54%
View Answer
Explanation: The sales in 1st quarter = 12500 units
The sales in 3rd quarter = 22500 units
The required percentage = 12500 / 22500 * 100 = 55.55%
More Data Interpretation Questions and Answers on Pie Chart:
To practice all aptitude questions, please visit “Data Interpretation Questions”, “1000+ Quantitative Aptitude Questions”, and “1000+ Logical Reasoning Questions”.
If you find a mistake in question / option / answer, kindly take a screenshot and email to [email protected]
