This set of Class 8 Maths Chapter 5 Multiple Choice Questions & Answers (MCQs) focuses on “Data Handling – Bars with a Difference”.
1. Which of the following is not a property of histogram?
a) The bars are of equal width
b) The adjacent bars have no gap
c) The adjacent bars have gap
d) The height of column gives number of data items in the given data range
View Answer
Explanation: Histogram is represented with bars of equal width with no gap between adjacent bars. The height of the bar represents the number of data items in the given data range called frequency.
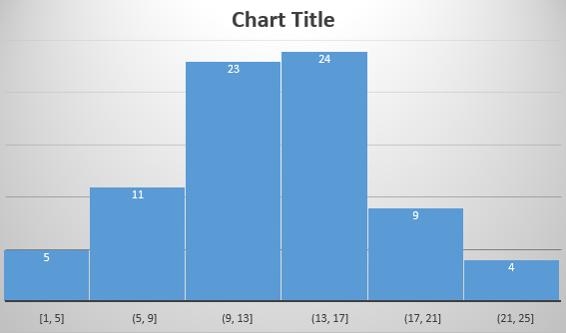
2. Below is the histogram of number of people in the age range from 1 – 25 years.
How many people are older than 5 and younger than 9 years?
a) 11
b) 5
c) 23
d) 24
View Answer
Explanation: The height of histogram represents the number of items in the given range called as frequency. Here, the number of people older than 5 and younger than 9 years are 11.
3. Below is the histogram of number of people in the age range from 1 – 25 years.
How many people are younger than 17 years?
a) 16
b) 23
c) 47
d) 63
View Answer
Explanation: The height of the bar represents the number of data items in the given data range called frequency. The number of people younger than 17 years is sum of number of people between 1-5, 5-9, 9-13 and 13-17 which gives us 63.
4. Below is the histogram of number of people in the age range from 1 – 25 years.
How many people are older than 13 years and younger than 25 years?
a) 37
b) 30
c) 63
d) 20
View Answer
Explanation: The height of the bar represents the number of data items in the given data range called frequency. The number of people older than 13 and younger than 25 years is sum of number of people between 13-17, 17-21, 21-25 which gives us 37.
5. Below is the histogram of number of people in the age range from 1 – 25 years.
Which group has maximum people?
a) 13-17
b) 9-13
c) 21-25
d) 17-21
View Answer
Explanation: The height of the bar represents the number of data items in the given data range called frequency. Maximum frequency in the given histogram is 24 which is for the range 13-17. So maximum people are older than 13 and younger than 17 years.
6. Below is the histogram of number of people in the age range from 1 – 25 years.
How many people are represented by the given histogram?
a) 37
b) 63
c) 72
d) 76
View Answer
Explanation: The height of the bar represents the number of data items in the given data range called frequency. The number of people represented by the histogram is sum of frequency of bars in the given histogram. Hence, we get number of people represented by histogram as 76.
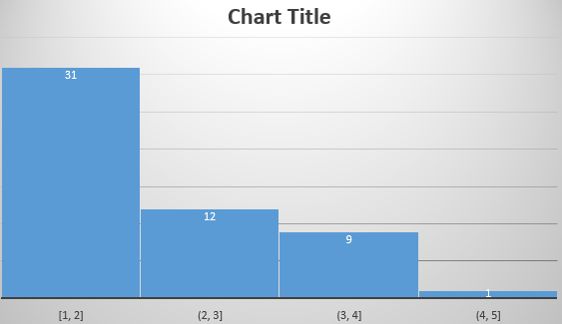
7. Below is the histogram of number of hours spent by students on mobile phones.
Which group has maximum students?
a) 1-2
b) 2-3
c) 3-4
d) 4-5
View Answer
Explanation: The height of the bar represents the number of data items in the given data range called frequency. Maximum students lie in the category of spending greater than 1 hour and less than 2 hours on mobile phones.
8. Below is the histogram of number of hours spent by students on mobile phones.
How many students spend more than 4 hours on mobile phone?
a) 9
b) 1
c) 31
d) 12
View Answer
Explanation: The height of the bar represents the number of data items in the given data range called frequency. The number of students spending more than 4 hours on mobile phone is 1.
9. Below is the histogram of number of hours spent by students on mobile phones.
How many students spend more than 2 hours and less than 5 hours on mobile phone?
a) 31
b) 43
c) 22
d) 21
View Answer
Explanation: The height of the bar represents the number of data items in the given data range called frequency. The number of students spending more than 2 hours and less than 5 hours on mobile phone is sum of frequency of 2-3, 3-4 and 4-5 which is 22.
10. Below is the histogram of number of hours spent by students on mobile phones.
How many students are represented in the given histogram?
a) 43
b) 53
c) 10
d) 21
View Answer
Explanation: The height of the bar represents the number of data items in the given data range called frequency. The total students represented by given histogram is sum of frequency of 1-2, 2-3, 3-4 and 4-5 which gives us 53.
Sanfoundry Global Education & Learning Series – Mathematics – Class 8.
To practice all chapters and topics of class 8 Mathematics, here is complete set of 1000+ Multiple Choice Questions and Answers.
If you find a mistake in question / option / answer, kindly take a screenshot and email to [email protected]
- Practice Class 9 Mathematics MCQs
- Check Class 8 - Mathematics Books
- Practice Class 10 Mathematics MCQs
