This set of Data Interpretation Questions and Answers (MCQs) focuses on “Pie Chart – Set 2”.
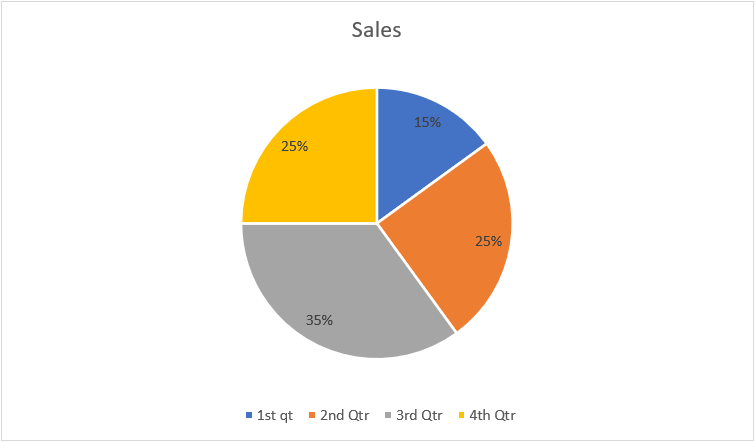
1. The total sales throughout the year was 4608 units, study the graph and find the sales in 2nd quarter.
a) 1152 units
b) 1512 units
c) 1251 units
d) 1125 units
View Answer
Explanation: The sales in 2nd quarter = 25 / 100 * 4608 = 1152 units.
2. The yearly sales were 10240 units, study the graph and find the sales in 3rd quarter.
a) 3584 units
b) 3984 units
c) 3594 units
d) 3444 units
View Answer
Explanation: The sales during the 3rd quarter = 10240 * 35 / 100 = 3584 units.
3. Study the graph and find the angle of the sector of the 3rd quarter.
a) 124 degrees
b) 122 degrees
c) 126 degrees
d) 128 degrees
View Answer
Explanation: The angle of the sector of the 3rd quarter = 35 / 100 * 360 = 126 degrees.
4. Study the graph and find the angle of the sector of the 4th quarter.
a) 75 degrees
b) 90 degrees
c) 105 degrees
d) 120 degrees
View Answer
Explanation: The angle of the sector of the 4th quarter = 25 / 100 * 360 = 90 degrees.
5. Study the graph and find what is the angle of the sector of the 1st sector?
a) 50 degrees
b) 54 degrees
c) 58 degrees
d) 62 degrees
View Answer
Explanation: The angle of the sector of the 1st quarter = 15 / 100 * 360 = 54 degrees.
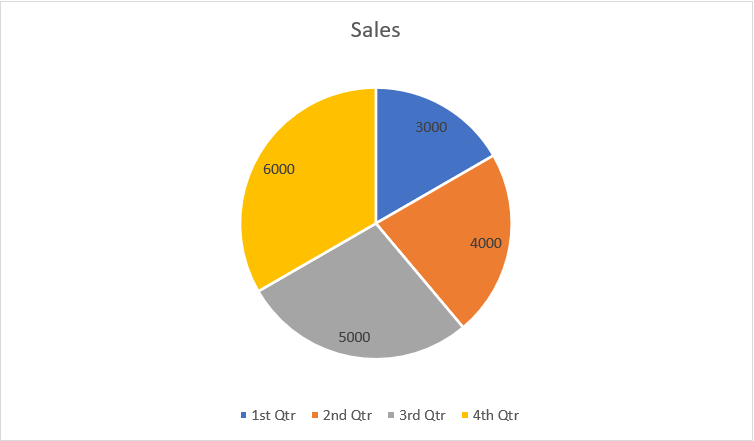
6. Study the graph and find what is the percentage sales of 1st quarter compared to the entire year?
a) 14.5%
b) 15%
c) 15.5%
d) 16.66%
View Answer
Explanation: The sales in the 1st quarter = 3000 units
The sales throughout the year = 3000 + 4000 + 5000 + 6000 = 18000
The required percentage = 3000 / 18000 * 100 = 16.66 %
7. Study the graph and find what is the angle of sector of the 3rd quarter?
a) 94 degrees
b) 97 degrees
c) 99 degrees
d) 100 degrees
View Answer
Explanation: The angle of the sector of the third quarter = 5000 / 18000 * 360 = 100 degrees.
8. Study the graph and find what is the average monthly sales throughout the year?
a) 1000 units
b) 1200 units
c) 1500 units
d) 1800 units
View Answer
Explanation: The average monthly sales throughout the year = (3000 + 4000 + 5000 + 6000) / 12 = 18000 / 12 = 1500 units per month.
9. Study the graph and find what is the average quarterly sales throughout the year?
a) 4500 units
b) 5000 units
c) 5500 units
d) 6000 units
View Answer
Explanation: The average quarterly sales = (3000 + 4000 + 5000 + 6000) / 4 = 18000 / 4 = 4500 units quarterly.
10. The sales in 1st quarter is to study the graph and find what percentage of the sales in the 3rd quarter?
a) 55%
b) 60%
c) 63%
d) 66.66%
View Answer
Explanation: The sales in 1st quarter = 3000 units
The sales in 3rd quarter = 5000 units
The required percentage = 3000 / 5000 * 100 = 60%
To practice all aptitude questions, please visit “Data Interpretation Questions”, “1000+ Quantitative Aptitude Questions”, and “1000+ Logical Reasoning Questions”.
If you find a mistake in question / option / answer, kindly take a screenshot and email to [email protected]
