This set of Drug Biotechnology Multiple Choice Questions & Answers (MCQs) focuses on “Pharmacokinetic – Plasma Drug Concentration Time Profile”.
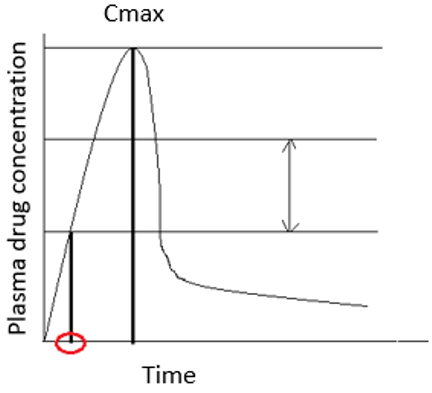
1. In plasma drug concentration versus time graph as shown in the picture, what should be the correct option for the marked place?

a) Maximum safe concentration
b) Minimum effective concentration
c) Therapeutic range
d) Onset of action
View Answer
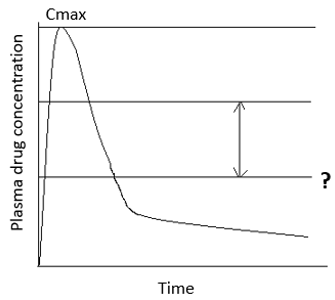
Explanation: This graph is plasma drug concentration versus time curve obtained after single oral dosage of a drug. Maximum safe concentration or the minimum toxic concentration is the concentration of drug in plasma above which adverse or unwanted effects are most probably to be occurred. Any concentration of drug above maximum safe concentration will be in the toxic level.
2. In plasma drug concentration versus time graph as shown in the picture, what should be the correct option for the marked place?
a) Maximum safe concentration
b) Minimum effective concentration
c) Therapeutic range
d) Onset of action
View Answer
Explanation: This graph is plasma drug concentration versus time curve obtained after single oral dosage of a drug. Minimum effective concentration is the minimum concentration of the drug in plasma which is necessary to produce a therapeutic effect. It also says about the minimum concentration of drug at the receptor site to elicit the desired pharmacological response.
3. In plasma drug concentration versus time graph as shown in the picture, what should be the correct option for the marked place?
a) Elimination phase
b) Post absorption phase
c) Absorption phase
d) Duration of action
View Answer
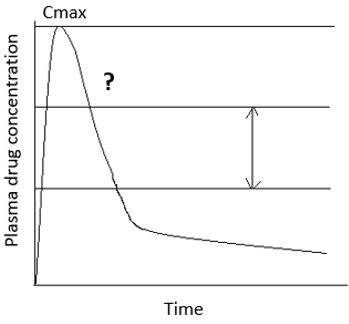
Explanation: Post absorption phase is the phase when the distribution of the drugs happens. This phase comes before the elimination phase. Post absorption phase comes after the absorption phase that is when all the drug molecules are absorbed into the plasma.
4. In plasma drug concentration versus time graph as shown in the picture, what should be the correct option for the marked place?
a) Elimination phase
b) Post absorption phase
c) Absorption phase
d) Duration of action
View Answer
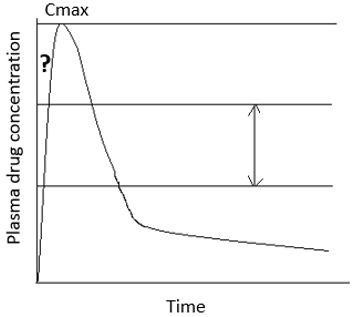
Explanation: Absorption phase is when the rate of absorption is greater than the rate of elimination. It is the left side of the curve. The peak represents the time when the absorption rate is equal to the elimination rate of drug.
5. In plasma drug concentration versus time graph as shown in the picture, what should be the correct option for the marked place?
a) Elimination phase
b) Post absorption phase
c) Absorption phase
d) Duration of action
View Answer
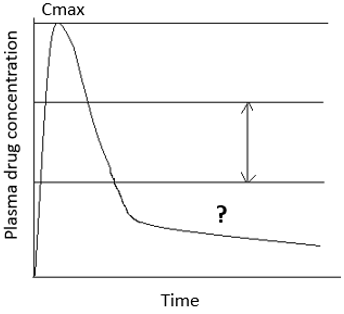
Explanation: The section of the curve to the right of peak represents the elimination phase. It is the part when the rate of elimination exceeds rate of absorption.
6. In plasma drug concentration versus time graph as shown in the picture, what should be the correct option for the marked place?

a) Maximum safe concentration
b) Minimum effective concentration
c) Therapeutic range
d) Onset of action
View Answer
Explanation: Onset of action is the beginning of the pharmacological response for a drug. The pharmacological action just occurs when the plasma drug concentration exceeds the minimum effective concentration.
7. In plasma drug concentration versus time graph as shown in the picture, what should be the correct option for the marked place?

a) Maximum safe concentration
b) Minimum effective concentration
c) Therapeutic range
d) Onset of action
View Answer
Explanation: The therapeutic range is between the minimum effective concentration and maximum safe concentration. This is the concentration where the drug continues to give therapeutic effect. Above this level, it will be toxic to the patient. And below this it won’t give a therapeutic effect.
8. In plasma drug concentration versus time graph as shown in the picture, what should be the correct option for the marked place?
a) Maximum safe concentration
b) Minimum effective concentration
c) Therapeutic range
d) Onset time
View Answer
Explanation: Onset time is the time required for the drug to start producing pharmacologic response. It is the time for the plasma concentration of the drug to reach the minimum effective dose after administration.
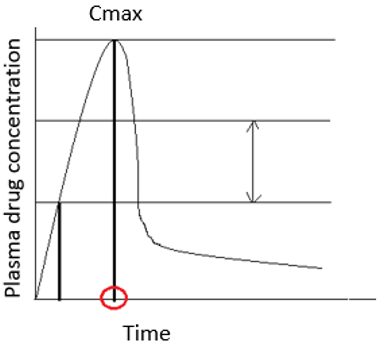
9. In plasma drug concentration versus time graph as shown in the picture, what should be the correct option for the marked place?
a) Maximum safe concentration
b) Minimum effective concentration
c) Tmax
d) Onset of action
View Answer
Explanation: It is the time needed for the curve to reach the peak. At the peak absorption rate is equal to the elimination rate. Thus, Tmax is the maximum required for the rate of absorption to be equal to the elimination rate.
10. The time period for which the plasma concentration of drug remains above minimum effective concentration is known as ______________
a) Onset of time
b) Onset of action
c) Duration of drug of action
d) Therapeutic range
View Answer
Explanation: The time period for which the plasma concentration of drug remains above minimum effective concentration is known as the duration of drug action. Onset of action is the time needed for the curve to reach the peak. Onset time is the time required for the drug to start producing pharmacologic response. The therapeutic range is between the minimum effective concentration and maximum safe concentration.
Sanfoundry Global Education & Learning Series – Drug and Pharmaceutical Biotechnology.
To practice all areas of Drug and Pharmaceutical Biotechnology, here is complete set of 1000+ Multiple Choice Questions and Answers.
If you find a mistake in question / option / answer, kindly take a screenshot and email to [email protected]
- Check Biotechnology Books
- Check Drug and Pharmaceutical Biotechnology Books
- Apply for Biotechnology Internship
- Practice Biotechnology MCQs
