This set of MATLAB Multiple Choice Questions & Answers (MCQs) focuses on “Impulse Response – 1”.
1. What is the impulse response of a system whose transfer function is that of ramp function delayed by 7 units in time?
a) r(t-7)
b) r(t+7)
c) r(t-3.5)
d) Cannot be determined
View Answer
Explanation: The impulse response is simply the inverse laplace transform of the transfer function. According to the given nature of the transfer function, the impulse response is then given by option r(t-7) only.
2. What is the impulse response of a system whose transfer function is that of pulse function?
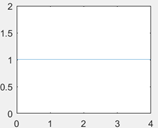
a) u(t)+u(t-4)
b) u(t)-u(t-3)
c) u(t)-u(t-4)
d) u(t)-u(t+4)
View Answer
Explanation: The inverse laplace transform of the transfer function gives the impulse response of a system. Now, the pulse shown in the above figure exists from t=0 to t=4 in time. The correct representation of the pulse is given by option u(t)-u(t-3) only.
3. What is the impulse response till t=16 unit in time of a system whose transfer function is that of the following?
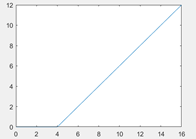
a) 3⁄4*r(t-4) + 3⁄4*r(t-16)+u(t-16)
b) 3⁄4*r(t-4) – 3⁄4*r(t+16)-u(t-16)
c) 3⁄4*r(t-4) – 3⁄4*r(t-16)-u(t-16)
d) 3⁄4*r(t-4) – 3⁄4*r(t+16)-u(t+16)
View Answer
Explanation: The correct representation of the signal shown in the graph is 3⁄4*r(t-4) – 3⁄4*r(t-16)-u(t-16). This is because the ramp function, starting from t=4 units in time, has a slope of 3⁄4 and it’s shown to end at t=16. So, there it faces a slope change to 0, so the 2nd term happens and finally, the amplitude becomes 0 which is why, the 3rd term happens.
4. What is the impulse response of the system whose transfer function is that of a pulse which generates from the following code?
plot(0:12,[zeros(1,4),ones(1,5),zeros(1,4)])
a) u(t-4)+u(t-9)
b) u(t+4)-u(t-9)
c) u(t-4)-u(t+9)
d) u(t-4)-u(t-9)
View Answer
Explanation: The pulse generated due to the following code, starts from t=4 and ends at t=9. The correct representation is only given by option d. Now, the impulse response is the inverse laplace transform of the system.
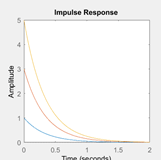
5. The following figure shows a set of impulse responses. Identify which system provides the greatest delay.
a) Blue
b) Red
c) Delay
d) Purple
View Answer
Explanation: The impulse response, represented by the purple color, suggests that the exponential factor which result in the delay of the system is higher.
6. The following figure shows a set of impulse responses. Identify which system provides the least delay.
a) Blue
b) Red
c) Delay
d) Purple
View Answer
Explanation: The impulse response, represented by the purple color, suggests that the exponential factor which result in the delay of the system is least. Hence, Delay is correct only.
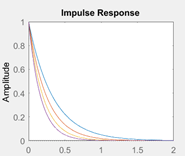
7. Which response has the highest amplitude of step function?
a) Yellow
b) Red
c) Blue
d) Data inadequate
View Answer
Explanation: The impulse response is a decreasing exponential curve. This means that the amplitude of the step function will be at t=0. Hence, the correct option is a. After t=0, the response decreases exponentially which is observed by taking the inverse laplace transform of the transfer function of the system.
8. Which response has the least amplitude in the transfer function?
a) Yellow
b) Red
c) Blue
d) Data inadequate
View Answer
Explanation: : The impulse response is a decreasing exponential curve. This means that the amplitude of the step function will be at t=0. Hence, the correct option is yellow. After t=0, the response decreases exponentially which is observed by taking the inverse laplace transform of the transfer function of the system.
9. The o/p of the following two code snippets are ___
i.  impulse(1,[ 6 3])
ii. impulse(1/6,[ 1 .5])
a) Same graphs
b) Different grpahs
c) Amplitude of graph i>ii
d) Amplitude of graph i<ii
View Answer
Explanation: The vector having zeros in the 1st code snippet contains the co-efficients of the polynomial 6s+3=1/6(s+.5). Hence, we find that the transfer function represented in the 2nd code snippet is similar to the 1st code snippet. Hence, the above two systems are same and yield the same graphs.
10. Fill the half-filled code snippet which generates the following curve:
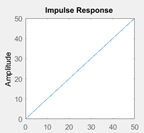
_______(1,[1 __])
a) impulse, 0, 0
b) impulse, 0
c) impulse, 0 1
d) impulse, 1, 0
View Answer
Explanation: The graph has generated a simple ramp function with slope=1. So, the impulse response is that of a ramp function. The laplace transform of ramp function is 1/s2. Hence, the correct option is a. Note that the command to be used is impulse only.
11. Fill the half-filled code snippet to get the following graph:
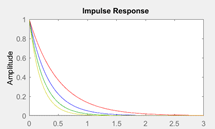
impulse(1,[1 _], ‘red’);
____;
impulse(1,[1 _], ‘blue’);
impulse(1,[1 _], ‘yellow’);
impulse(1,[1 _], ‘green’);
a) 2, hold, 3,4,5
b) 9, hold, 4,5,2
c) 5, hold, 4,3,2
d) Cannot be determined
View Answer
Explanation: The above code shows that after each impulse command, the amplitude of the exponential decreases faster- besides this, it reveals that the order of the input transfer function is 1 so the transfer function is a step signal. Since we’ve plotted the impulse response, we observe that the transfer function is of the form (1/s-a) and if |a| increases, the response decreases faster. Hence, the only plausible option is a. The hold command should be used to plot multiple graphs on the same window.
12. Choose the correct option after observing the given graph and the code snippet carefully.
impulse(1,[1 _], ‘red’);
hold on;
impulse(1,[1 a], ‘blue’);
impulse(1,[1 b], ‘yellow’);
impulse(1,[1 _], ‘green’);
a) a<b
b) a>b
c) a=b
d) Cannot be determined
View Answer
Explanation: After successive commands, the responses decreases at a faster rate. This means that the vector containing poles, given as an input to the impulse command, should have the missing elements increasing because the value of that element signifies the speed of exponential change. Hence, a should be less than b since the output due to b decreases faster as compared to that of a.
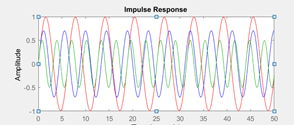
13. How does the pole of the transfer function change?
a) Goes nearer to the origin for the green curve than the red curve
b) Goes further from the origin for the red curve than the blue curve
c) Goes nearer to the origin for the blue curve than the red curve
d) Goes nearer to the origin for the red curve than the blue curve
View Answer
Explanation: As the impulse response suggests that each response is sinusoidal, the frequency of the sinusoid will be the value of the pole in the s-plane. If the frequency increases, the pole goes further from the curve- the output frequency increases. Hence, the plausible option is d since the frequency increases or the pole nearer to the origin from the green to the red and away form the origin from the origin from red to green.
14. Which response would provide a higher stability?
a) A step signal
b) A ramp signal
c) A sinusoidal
d) 1/(s-1)
View Answer
Explanation: All the first three options are unstable since their ROC doesn’t include the imaginary axis. For option 1/(s-1), the pole lies in the left half of s-plane and the R.O.C. includes the imaginary axis.
15. The poles of the transfer function of a sinusoidal system can represent the frequency of the impulse response of the sinusoidal system.
a) True
b) False
View Answer
Explanation: The lapalce transform of the sinusoid represents the frequency of the signal as a pole. Since the response is sinusoidal, the transfer function is the laplace transform of the impulse response which contains the frequency as the pole of the sinusoidal system.
Sanfoundry Global Education & Learning Series – MATLAB.
To practice all areas of MATLAB, here is complete set of 1000+ Multiple Choice Questions and Answers.
If you find a mistake in question / option / answer, kindly take a screenshot and email to [email protected]
