This set of MATLAB Multiple Choice Questions & Answers (MCQs) focuses on “Graphics”.
1. What are the functions to see the graph of a continuous and a discrete function?
a) plot() & stem()
b) cont() & disc()
c) plot() & disc()
d) cont() & stem()
View Answer
Explanation: The pre-defined function in MATLAB to view the graph of a continuous and discrete functions is plot() and stem() respectively. There is no such function as cont() or disc().
2. Find the error in the following code.
x=-10:1:10; y=-10:2:10; plot(x,y)
a) Plot is not available in MATLAB
b) Syntax of plot is wrong
c) Length of x and y should be same
d) No error
View Answer
Explanation: It is highly important that the length of the variables, between which we need to plot a graph, be same. This is a pre-defined syntax of MATLAB so MATLAB will return an error if the lengths are not same.
3. What is the output in the following code?
x=-10:1:10; y=-10:1:10;axis(‘off’); plot(x,y)
a) Error
b) A graph will be shown without axes
c) A graph will be shown with axes
d) 2 graphs will be shown- one with axes and with no axes
View Answer
Explanation: We have used the axis command before the plot command. So, the plot hasn’t been created before the axis command is invoked. Hence a graph of x and y will be shown which will have axes.
4. If we want to plot matrix arguments, which of the following gets plotted?
a) Column wise inter-relation of two arguments
b) Row wise inter-relation of two arguments
c) Diagonally inter-relation of two arguments
d) The arguments are incomprehensible
View Answer
Explanation: We have to keep in mind the order while trying to plot two matrix arguments. MATLAB will take the column wise relation between the two arguments.
So, if x=[x1 x2 x3];y=[y1 y2 y3]; plot(x,y)- MATLAB will generate a plot between (x1,y1),(x2,y2) and so on.
5. To bring the scale of each axis to logarithmically spaced, the student entered ‘semilogx()’. What really happened?
a) The plot will appear with both axis now logarithmically spaced
b) semilogx() is an invalid function
c) The plot will appear with x axis logarithmically spaced
d) Error
View Answer
Explanation: semilogx() is a pre-defined logarithmic plot function in MATLAB. It will help to bring down the scale of the x axis in out plot to logarithmically spaced values.
6. What kind of a plot is this?
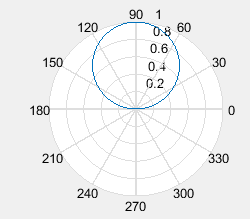
a) Polar plot
b) Cartesian plot
c) Complex plot
d) Not a MATLAB plotting
View Answer
Explanation: MATLAB generates a polar plot to represent the polar co-ordinates of a trigonometric function. This is done with the help of the function ‘polar(angle,radius)’. The angle increases in the anti-clockwise direction.
7. After trying to plot a pie-chart, the student finds that the function he used is rose(). What is the nature of data used by the student if an output graph is generated?
a) Angles in radians
b) Linear bivariate
c) Logarithmic
d) This is not possible in MATLAB
View Answer
Explanation: The student gets an angle histogram plot. So, he used the wrong function. But the plot was generated. So, his lines of code have defined the date in terms of angles. Plus he has used the rose command in place of the pie command.
8. To place a text on the plot using a mouse, the command used is _________
a) gtext
b) text
c) title()
d) atext
View Answer
Explanation: This is a pre-defined function in MATLAB. If we want to place a text at a position, of our interest, in a graph- we need to use the gtext command.
9. What is the condition on x in bar(x,y)?
a) No condition as such
b) Should change linearly
c) Should increase of decrease monotonously
d) Incomprehensible
View Answer
Explanation: The values of x should be increasing monotonously or decreasing monotonously. This is due to the fact that each argument in x refers to the particular position of a bar in the bar plot.
10. If we put bar(x,y,1.2), we will get _____ bars.
a) Uniform
b) Damped
c) Overlapping
d) No
View Answer
Explanation: Usually, the default value of width is 0.8 for the function ‘bar()’. Now, if we increase bar width to a value more than 1, the bars would overlap on each other- resulting in a bar plot of overlapping bars.
11. A student has to plot a graph of f(x)=t and g(y)=t in the same graph, with t as a parameter. The function he uses is ____
a) plot3(x,y,t)
b) plot(x,y,t)
c) disp
d) stem(x,y)
View Answer
Explanation: The function to be used is plot3(x,y,t). This will allow him to draw a 3d plot as asked. The plot will show both the functions ‘f’ and ‘g’ with t on the z-axis.
Sanfoundry Global Education & Learning Series – MATLAB.
To practice all areas of MATLAB, here is complete set of 1000+ Multiple Choice Questions and Answers.
If you find a mistake in question / option / answer, kindly take a screenshot and email to [email protected]
