This set of MATLAB Multiple Choice Questions & Answers (MCQs) focuses on “Operations on Signals – 1”.
1. What is the following graph if u(t) denotes step function?
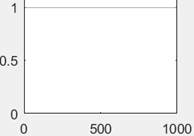
a) u(t+0)
b) u(t)-u(t-1000)
c) u(t-0)
d) u(t)
View Answer
Explanation: The unit step signal extends from 0 to infinity. When we plot it in MATLAB, we bound it to a certain point in time. In this case, we have bounded it to 1000 units in time. Hence, option u(t)-u(t-1000) is correct. Option a, c and d mean the same thing but it’s not possible to represent the unit step function graphically.
2. What is the following graph if u(t) denotes step function and r(t) denotes ramp function?
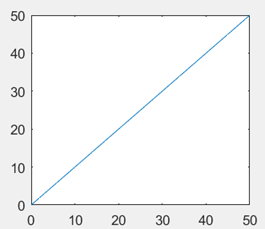
a) r(t)
b) r(t)-r(t-50)-u(t-50)
c) r(t)-r(t-50)
d) r(t)-u(t-50)
View Answer
Explanation: A ramp function extends upto infinity. But here, the graph ends a 50 units in time. So, the function has a slope change at t=50 and the new slope is 0. But the function value is 0 fo r t>50 so we need to subtract the function, resulting at t=50, from a unit step function starting from t=50. Hence, the correct solution is option c only.
3. What does the following code generate?
p=ones(1,90);
t=(0:1:89);
plot(t,p);
a) A graph of a unit step function
b) A graph of a pulse function
c) A graph of a triangular pulse function
d) An impulse function
View Answer
Explanation: The unit step function extends upto infinity and it’s not possible to represent it graphically. The above code plots a pulse function, of amplitude 1 which extends upto 89 units in time and is represented by u(t)-u(t-89). It doesn’t generate an impulse or a triangular pulse function.
4. What is the following graph, if del(t) represents the impulse function?
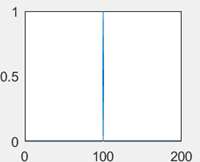
a) del(t)
b) del(t-100)
c) del(t+100)
d) del(t-50)
View Answer
Explanation: The above graph shows the impulse function at t=+100. This means that the function has been delayed by 100 units of time. Hence, the correct option is del(t-100).
5. The convolution of [1 2 1] and [1 2 1] will have the highest amplitude at t= _________
a) 3 units
b) 0 units
c) 1 unit
d) 2 units
View Answer
Explanation: If we observe the process of graphical convolution, we find that since, the given two signals are equal to each other, the maximum amplitude of the signal generating due to convolution will be midway between the total length of the resultant signal. This is due to the fact that at that instant, one signal lies on top of another. Now the total length of the convolved signal is 5 units(0,1,2,3,4) and the middle point is t=2. Hence, the correct option is t=2 units.
6. What is the output of the following code?
a=[1 2 3];
b=2;
a.\b;
a) .5 1 1.5
b) 2 1 .67
c) Error
d) Cannot be determined
View Answer
Explanation: a.\b signifies a divides b so b is divided by the elements of vector a. Hence, option b is correct. The answer would’ve been .5 1 1.5 is it was a./b.
7. What is the output of the following code?
a=[1 2 3];
b=2;
conv(a,b)
a) 2 4 6
b) 1 2 3
c) 0 0 0
d) 2 3 1
View Answer
Explanation: The process of graphical convolution will yield that the signal b only gets multiplied with an at the instants where a exists i.e at 1,2 and 3 units in time. Hence, the correct option is 2 4 6 only.
8. What is the output of the following code?
T=0:1:9;
stem(T);
a) A ramp function
b) r[n]-r[n-9]-9u[n-9]
c) r[n]-r[n-9]
d) Error
View Answer
Explanation: Since the ramp function extends upto infinity, it cannot be represented graphically. The above code plots the ramp function from 0 to 9 units in time but the signal is represented algebraically by option r[n]-r[n-9]-9u[n-9] only. At the instant n=9, the slope of the ramp function becomes 0 so the slop changes twice i.e. first r[n] gets reduced to a step function when r[n-9] gets subtracted from it. Then we simply subtract a step function of amplitude 9 from it to get the final function.
9. What is the output of the following code?
Y=rectpulse(1,9);
t=0:1:8;
plot(t,y);
a) A rectangular pulse extending from 0 to 8 units in time
b) A rectangular pulse with increasing amplitude
c) Error
d) Cannot be determined
View Answer
Explanation: The rectpulse() command returns a column vector. But t is a row vector. So, the plot command will create an error. This is why, we need to take the transpose of the y vector and put it in the plot command.
10. What is the output of the following code?
Y=rectpulse(1,9);
p=y’;
t=0:1:9;
plot(t,p);
a) u(t)-u(t-9)
b) u(t) till 9 units in time
c) Error
d) Cannot be determined
View Answer
Explanation: The length of p is 9 but that of t is 10. This will result in an error in the plot command. The t vector should be from 0 to 8 or we can have rectpulse(1,10). If we want u(t)-u(t-9), the latter is to be chosen. But here, the plot command will give an error.
Sanfoundry Global Education & Learning Series – MATLAB.
To practice all areas of MATLAB, here is complete set of 1000+ Multiple Choice Questions and Answers.
If you find a mistake in question / option / answer, kindly take a screenshot and email to [email protected]
