This set of MATLAB Multiple Choice Questions & Answers (MCQs) focuses on “Customizing and Manipulating Graphics – 1”.
1. How can we introduce texts in a graph?
a) Use the text command
b) Use the plot command
c) Use the title command
d) Additional texts not possible
View Answer
Explanation: The plot command will be to plot the graphs only. The title command is used to introduce a title outside the graph. A text can be introduced in a graph by using the text command.
2. What is the output of the following code?
t=linspace(0, 2*pi, .1*pi); plot(t,sin(t)); text[2,-2, ‘Ho !’];
a) a graph of sin(t)
b) a graph of inverted sin(t)
c) a graph with Ho ! written
d) error
View Answer
Explanation: The input to the text command should be within parentheses. Here, the [] will result in an error. If a parentheses was used, the output would’ve been a graph of sin(t).
3. How many objects are created for 24 texts written in the graph?
a) 22
b) 24
c) 21
d) 2
View Answer
Explanation: The text command would be created 24 objects in the memory for 24 texts added in the graph. It will be able to access those texts and edit them.
4. What is the output of the following code?
t=linspace(0:.1*pi:2*pi);plot(t,sin(t));text(0.5,1,’Ho !’,’colour’,’red’)
a) Error
b) A graph with Ho! written
c) A An inverted sinusoid
d) An inverted sinusoid with Ho written
View Answer
Explanation: The text property added in the above code is ‘Colour’. This is the error, it should’ve been ‘color’. Then the output of the following code would’ve been A graph with Ho! written.
5.What is the output of the following code?
t=linspace(0:.19*pi:27*pi);plot(t,sin(t));text(0.5,1,’color’,’red’)
a) Error on plot command
b) Error in linspace command
c) Error in text command
d) A graph of a sinusoid with Ho ! written on it.
View Answer
Explanation: The inputs to the linspace command are to be separated by a semi-colon. Here, MATLAB will give an error because the inputs are separated by a :.
6. What is the output of the following code?
t=linspace(0,.00002*pi,2*pi);plot(t,cos(t));text(0.5,1,'color','blue')
a) Syntactical Error due to text command
b) Input error due to text command
c) Error in linspace command
d) A graph of sinusoid with Ho ! written on it
View Answer
Explanation: We haven’t given any string input to the text command which we want to show in the graph. Hence, MATLAB will send an error due to the text command. The rest of the code is okay.
7. What is the output of the following command?
t=linspace[0,20*pi,2*pi];plot(t,tan(t));text(0.5,1,'Ho!','color','blue')
a) Syntactical error in the text command
b) Error in input of plot command
c) Error in linspace command
d) The graph of tan(t) w.r.t. t with Ho ! writted
View Answer
Explanation: The input to the linspace command should be within a parentheses. Here, we’ve used [] so MATLAB will give an error.
8. What is the output of the following code?
t=linspace(0,.5,2*pi);plot(t,sin(t));text(0.5,1,'\mu Ho!','color','blue')
a) A sinusoid with µHo! written
b) A sinusoid with Ho! written
c) Error in the text command
d) A sinusoid with \mu Ho! written
View Answer
Explanation: The interpretation of \mu is µ and hence A sinusoid with µHo! written is correct. There is no error in the text command.
9. What is the output of the following code?
t=[-10:1:10];plot(t,t), text(0,0,’Origin’,color,’blue’)
a) A ramp function with Origin written in Blue
b) A ramp function with Origin written in Blue and center left alignment
c) Error
d) A ramp function with Origin
View Answer
Explanation: It displays a ramp function with Origin written in Blue.
10. The text given to the graphs can be made bold.
a) True
b) False
View Answer
Explanation: The texts given to the graph can be made bold by giving \bf and the writing the text which we want to make it bold. Hence, the above statement is true.
11. The font style of the input text can be changed by the ____
a) fontname{}
b) fontstyle{}
c) fontname()
d) fontname[]
View Answer
Explanation: The desired fontname could be given in the style denoted by fontname{}, to the text command. This will change the font of the text printed in the graph.
12. What is the output of the following code?
t=[-10:1:10];plot(t,3*t), text(0,0,’Origin’,color,’blue’,’verticalalignment’,’left’)
a) A ramp function with Origin written in Blue and left alignment
b) A ramp function with Origin written in Blue
c) A ramp function with Origin written in Blue and center left alignment
d) Error
View Answer
Explanation: The left is not the correct value for vertical alignment. The correct values are namely ‘center’, ‘base’, ‘middle’, ‘top’. Hence, the above code will only give an error.
13. The default colour of graph generated by the plot command is blue.
a) True
b) False
View Answer
Explanation: The default color of the graph generated by the plot/stem command is blue. I tcan be changed from the plot command itself or the set command.
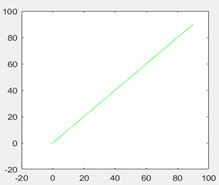
14. What is the output of the following command?
T=[-1:1:90];plot(T,T,’G’)
a) A green ramp function
b) Error
c) A grey ramp function
d) A ramp function
View Answer
Explanation: There is no error in the above code. It will generate a green colored ramp function.
Output:
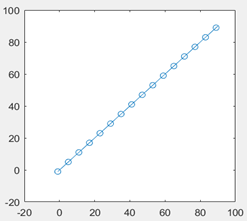
15. What is the output of the above code?
T=[-1:1:90];plot(T,T,’-o’, 'MarkerIndices',1:6:length(T))
a) A green ramp function
b) A ramp function with y value marked at lengths of 5
c) A ramp function with y value marked
d) A ramp function with y value marked at lengths of 6
View Answer
Explanation: The above code will plot a ramp function and mark the y values separated by 5 units from the initial value.
Output:
Sanfoundry Global Education & Learning Series – MATLAB.
To practice all areas of MATLAB, here is complete set of 1000+ Multiple Choice Questions and Answers.
If you find a mistake in question / option / answer, kindly take a screenshot and email to [email protected]
