This set of MATLAB Multiple Choice Questions & Answers (MCQs) focuses on “Two-Dimensional Plots – 1”.
1. How can we smoothen the following graph of sin (t) and cos (t) into a circle?
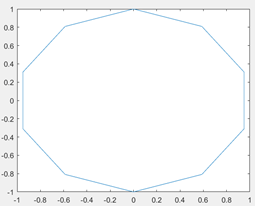
a) reduce the gap between linearly spaced elements of the dependent variable t
b) reduce the gap between elements of the dependent variable t
c) increase the gap between linearly spaced elements of the dependent variable t
d) increase the gap between elements of the dependent variable t
View Answer
Explanation: If we reduce the gap between the linearly spaced variables of t, the curvature of sin(t) would be clearly plotted by the plot command. Hence, the resultant curve would be a circle.
2. Which command gives a title to the graph plotted by MATLAB?
a) plot() generates the title itself
b) title()
c) hlabel()
d) heading()
View Answer
Explanation: The title() command is used to provide a title to the graph plotted in MATLAB. It can be provided from the taskbar of the window which opens due to the plot command.
3. Which command enables a title for the x-axis?
a) xlabel()
b) horilabel()
c) xlabel[]
d) no command
View Answer
Explanation: The xlabel() command is used to include a title to signify the x-axis of the graph plotted in MATLAB. Hence, the only correct option is xlabel().
4. Which command enables a title for the y-axis?
a) vertlabel()
b) ylabel()
c) ylabel[]
d) no command
View Answer
Explanation: The command ylabel is used to name the y axis of the graph plotted in MATLAB. Hence, option ylabel() is correct.
5. How can several graphs for the same function be plotted on the same window?
a) Contour plots
b) Bode plots
c) 3-D plots
d) n-D plots
View Answer
Explanation: Contour plots allow the plot of multiple curves of the same function on different constant levels of the function. This is extremely helpful in analyzing systems.
6. What is the output of the following command?
meshgrid[x,y]
a) two x*y matrices
b) one x*y matrix
c) one y*x matrix
d) error
View Answer
Explanation: The meshgrid command takes input within a set of parentheses. Hence, the above code will show an error since the input is given in [].
7. What is the output of the following code?
t=0:0.001*pi:pi/2;
plot(t,sin(t),*);
a) An inverted sine curve
b) A sine curve
c) A point
d) Error
View Answer
Explanation: The Asterix, given as an input to the plot command, should be given within a pair of single inverted commas. Thus the above code will give an error.
8. What is the slope of the sawtooth waveform generated by the sawtooth command?
a) 1/pi
b) pi
c) 1/(2*pi)
d) 2*pi
View Answer
Explanation: The slope of the sawtooth waveform always has a slope of 1/pi.
9. What is the period of the sawtooth() waveform which is generated by the sawtooth() command?
a) 2*pi
b) pi*2
c) pi
d) 3*pi/2
View Answer
Explanation: The sawtooth() command generates a sawtooth waveform which changes it’s peak from -1 to 1 in the period 2*pi. This is inbuilt in MATLAB and so the correct answer is 2*pi.
10. The command used to generate an array of arrows is ________
a) quiver[]
b) arrows()
c) quiver()
d) arrows[]
View Answer
Explanation: The command quiver is used to generate an array of arrows. This command is used during plotting fields in 2-D. It is used to show the direction of strength of the field that is being plotted.
11. What is the output of the following code?
t=0:.001*pi:2*pi;
plot(cos(t),sin(t))
a) A circle
b) A straight line
c) A unit circle
d) A sinusoid
View Answer
Explanation: The above code generates the unit circle which is used to define the z-plane. The graph is plotted between the values of cos(t) and sin(t) over their respective time period. It won’t generate a sinusoid or a straight line.
12. The period of sinusoidal curves can be changed in MATLAB.
a) True
b) False
View Answer
Explanation: The sin() command is defined to generate a sinusoid with a fundamental time period of 2*pi. The period of sinusoid can be changed by changing the angular frequency while giving input to the sine command.
13. The command to draw the nature of a function over a default fundamental period is _________
a) ezplot()
b) plot()
c) stem()
d) plot3()
View Answer
Explanation: The plot, stem and the plot3() command does not have a default fundamental period, we need to define the period of x-axis. The ezplot command generates a plot of the input function over a default fundamental period. This fundamental period is [-2*pi,2*pi].
14. In the following code, what is the fundamental frequency of the sawtooth command?
f=1/50; sawtooth(2*pi*1/f*t)
a) 50
b) .02
c) 100
d) Error
View Answer
Explanation: The input to the sawtooth command is a vector which is changing with a fundamental frequency. Here, 1/f is the fundamental frequency which 50. Hence the answer is 50.
15. The limits of the axes drawn are only specified in the command used to plot the graph itself.
a) True
b) False
View Answer
Explanation: The axis command can be used to define the limits of the axis present on the graph that is being plotted. The x-axis of the graph would contain values according to the input to the plot/stem command but the visible part of the graph in the new window will depend on how the length of the axes are defined by the axis command.
Sanfoundry Global Education & Learning Series – MATLAB.
To practice all areas of MATLAB, here is complete set of 1000+ Multiple Choice Questions and Answers.
If you find a mistake in question / option / answer, kindly take a screenshot and email to [email protected]
