This set of Engineering Hydrology Multiple Choice Questions & Answers (MCQs) focuses on “Synthetic Unit Hydrograph”.
1. Which of the following hydrographs is derived from empirical equations relating the hydrograph characteristics with the catchment features?
a) Distribution graph
b) Unit hydrograph
c) Instantaneous unit hydrograph
d) Synthetic unit hydrograph
View Answer
Explanation: The area for which the unit hydrograph needs to be plotted is studied and empirical equations are formulated which are applicable only to that region. The unit hydrographs which are then derived using these equations are known as synthetic unit hydrograph.
2. Which scientist developed a set of empirical equations correlating the features of unit hydrograph and basin for the purpose of synthetic unit hydrograph in the United States?
a) Snyder
b) Bligh
c) Kirpich
d) Khosla
View Answer
Explanation: In 1938, Snyder studied the basins in the Appalachian region of the US and came up with a set of equations to plot a unit hydrograph which were applicable to that region and some other parts of the US.
3. Change in land use and land cover affects the basin lag time.
a) True
b) False
View Answer
Explanation: Urbanization leads to change in land cover and is an example of change in land use. It intervenes with the natural hydrologic cycle affecting processes like interception, infiltration and transpiration. This leads to changes in surface runoff volume which implies change in basin lag time.
4. In the synthetic unit hydrograph, which of the following dimensions represents basin lag time? (The shaded region represents rainfall excess)
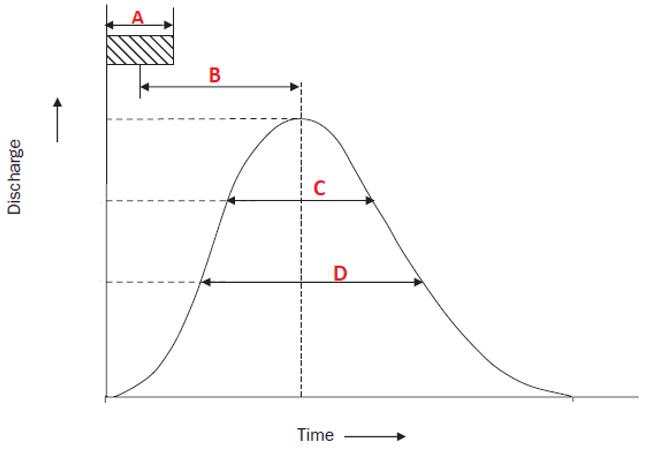
a) A
b) B
c) C
d) D
View Answer
Explanation: On a synthetic unit hydrograph, basin lag can be shown as the time elapsed between the centroid of the rainfall excess graph and the centroid (generally, the peak) of the hydrograph.
5. Which of the following is not associated with basin lag, which is an important factor in the derivation of synthetic unit hydrograph for a given catchment?
a) It has units of time
b) It is the distance between the end of rainfall excess and peak of DRH
c) It depends on the topographical features of the catchment like size, shape and slope
d) It is the average time taken by water from all parts of the catchment to reach the outlet
View Answer
Explanation: Since the basin lag is a mean quantity, its starting point on the hydrograph is represented by the centroid of rainfall excess hyetograph and ends at the peak of the DRH.
6. The following equation by Snyder gives the basin lag ‘t’ (in hours) as,
t = Ct.(LLca)n
where, Ct = regional constant representing the slope of the catchment and storage effects
L = length of basin along the water course from gauging station to divide, in km
Lca = length of water course from gauging station to a point near the catchment centroid, in km
What is the value of constant n?
a) 0.3
b) 0.5
c) 0.6
d) 0.9
View Answer
Explanation: The given equation is an empirical equation developed by Snyder for a specific region of the United States. The value of n used is constant and is 0.3.
7. The following equation by Snyder gives the basin lag ‘t’ (in hours) as,
t = Ct.(LLca)0.3
where, Ct = regional constant representing the slope of the catchment and storage effects
L = length of basin along the water course from gauging station to divide, in km
Lca = length of water course from gauging station to a point near the catchment centroid, in km
What is the range of Ct as per Snyder’s study?
a) 0.3 to 0.6
b) 0.55 to 0.85
c) 1.35 to 1.65
d) 2 to 3
View Answer
Explanation: The value of Ct as per Snyder varies from 1.35 to 1.65. However, many other researches have indicated that Ct depends on the region under observation and widely varying values of this constant, ranging from 0.3 to 6 have been reported.
8. As per Snyder’s equation, the basin lag does not depend on which of the following factors?
a) Basin slope
b) Basin size
c) Basin retention capacity
d) Length of main stream
View Answer
Explanation: As per Snyder’s equation, basin lag depends on the basin length and stream length along the basin. It also depends on the catchment slope through the constant Ct. Basin storage capacity affects the calculation of peak discharge.
9. A catchment of 100 km2 area has a main stream of length 20 km and the distance along the stream from the gauging station to the point nearest to the catchment centroid is 13.3 km. What will be the lag time (in minutes) as per Snyder’s equation? Assume the regional catchment constant as 1.5.
a) 5.6
b) 8
c) 330
d) 480
View Answer
Explanation: As per Snyder’s equation
t=Ct.(LLca)0.3
Substituting given values,
t=1.5*(20*13.3)0.3
t=8 hours=480 minutes
10. For a circular catchment of radius 9 km with Snyder’s regional constant as 1.45, the main stream runs end to end along the diameter of the basin. What will be average time (in hours) taken by water from all parts of the basin to reach the gauging station at the outlet?
a) 4.40
b) 5.42
c) 6.67
d) 8.21
View Answer
Explanation: Basically, the lag time is asked. From Snyder’s equation,
t=Ct.(LLca)0.3
Since the catchment is circular in shape and main stream runs along a diameter, L=18 km and Lca = 9 km. So, t=1.45*(18*9)0.3
⇒t = 6.67 hours
Sanfoundry Global Education & Learning Series – Engineering Hydrology.
To practice all areas of Engineering Hydrology, here is complete set of 1000+ Multiple Choice Questions and Answers.
If you find a mistake in question / option / answer, kindly take a screenshot and email to [email protected]
