This set of Verbal Reasoning Questions and Answers (MCQs) focuses on “Venn Diagram – Set 2”.
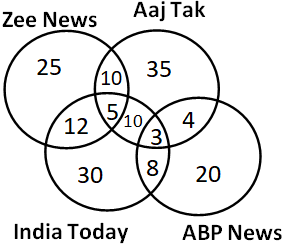
1. The following diagram shows the number of people watching news channels Aaj Tak, Zee News, ABP News and India Today. If the total number of people is 400, then what is the percentage of people watching only two of the channels among the following?
a) 8
b) 11
c) 9.25
d) 13
View Answer
Explanation: Number of people who watch only two news channels:-
10 + 10 + 4 + 12 + 8 = 44
Therefore, required percentage
= (44 ÷ 400) × 100 = 11%
2. Which of the following diagram correctly represents the relationship among Teacher, Men and Author?
a)

b)

c)

d)

View Answer
Explanation: Some teachers can be authors. Some men can be teacher or author.
Hence the diagram will be:

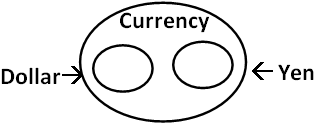
3. Which of the following diagram depicts the relation among Currency, Dollar and Yen?
a)
b)
c)

d)
View Answer
Explanation: Dollar and Yen both are currencies. But other currencies are also there. Also Dollar and Yen are different currencies.
Hence, the diagram will be:
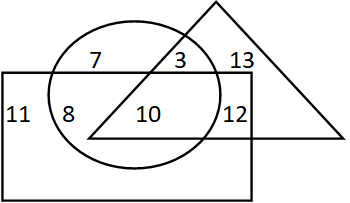
4. If triangle represents poor people, rectangle represents educated people and circle represent jobs. Then which number represents uneducated poor people who are in jobs?
a) 10
b) 12
c) 8
d) 3
View Answer
Explanation: Here, the number of uneducated poor people who are in jobs should be common in triangle and circle but not in rectangle.
Hence, 3 is the answer.
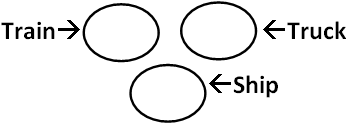
5. Which of the following figures shows relation between Train, Ship and Truck?
a)
b)

c)

d)
View Answer
Explanation: Here, Train, Truck and Ship all are different types of vehicles.
Hence, the diagram will be:-
6. Which of the region in the following figure represents students who play Volleyball or Football or both but not Basketball?
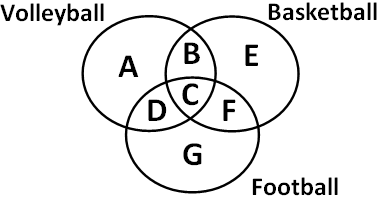
a) A + D + G
b) C + D
c) A + G – D
d) D
View Answer
Explanation: Here, region A+G-D represents the students who play Volleyball or football or both but not Basketball.
Hence A + G – D is the answer.
7. From the figure given below, determine the number of students who did not study any of the two subjects.
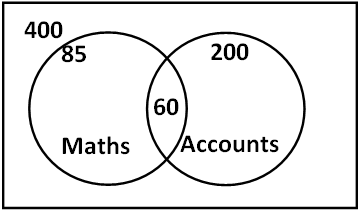
a) 135
b) 75
c) 195
d) 175
View Answer
Explanation: Here, the number of students who study any of these subject is:-
200 + 85 – 60 = 225
Since, total number of students is 400, therefore, the number of students who did not study any of these subjects is:-
400 – 225 = 175
Hence, 175 is the answer.
8. Which of the following figures correctly represents the relation between Mars, Phobos and Deimos?
a)
b)
c)
d)
View Answer
Explanation: Here, Mars is a planet and Phobos and Deimos are the name of moons of Mars.
Hence, the diagram will be:-

9. Which of the following diagram depicts the relation among Facebook, WhatsApp and Instagram?
a)
b)
c)
d)
View Answer
Explanation: Here, both WhatsApp and Instagram are under Facebook and both are different social networking sites.
Hence, the diagram will be:-

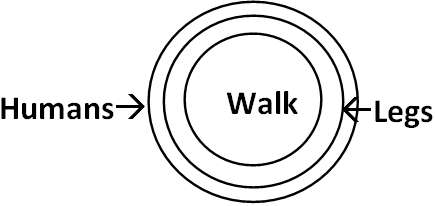
10. Which of the following figure correctly represents relation among Humans, Legs and Walk?
a)
b)
c)
d)
View Answer
Explanation: Here, walking is done by legs and legs come under humans.
Hence, the diagram will be:-
To practice all aptitude questions, please visit “1000+ Logical Reasoning Questions”, “1000+ Quantitative Aptitude Questions”, and “Data Interpretation Questions”.
If you find a mistake in question / option / answer, kindly take a screenshot and email to [email protected]
