Here are Data Interpretation Questions and Answers (Topic wise).
1. Study the table and find the value of r.
| Cost price | Marked price | Discount | Selling price | Profit/Loss % | |
| Article 1 | 12500 | +20% | 10% | M | R |
| Article 2 | 12780 | +25% | 15% | N | S |
| Article 3 | 12560 | (-) 30% | 12% | O | T |
| Article 4 | 12210 | (-) 10% | 22% | P | U |
| Article 5 | 12200 | +50% | 20% | Q | V |
a) 8%
b) 6%
c) 15%
d) 12%
View Answer
Explanation: r is the profit or loss percent on selling article 1.
The cost price of article = 12500 rupees
The marked price of the article = 12500 + 20% of 12500 = 12500 + 2500 = 15000
The discount allowed = 10%
The discount = 10% of the marked price = 10% of 15000 = 1500
The selling price = 15000 – 1500 = 13500
The profit = 13500 – 12500 = 1000 rupees
The profit percent = 1000 / 12500 * 100 = 8% profit
2. Study the table and find the average of m and q.
| Cost price | Marked price | Discount | Selling price | Profit/Loss % | |
| Article 1 | 12500 | +20% | 10% | M | R |
| Article 2 | 12780 | +25% | 15% | N | S |
| Article 3 | 12560 | (-) 30% | 12% | O | T |
| Article 4 | 12210 | (-) 10% | 22% | P | U |
| Article 5 | 12200 | +50% | 20% | Q | V |
a) 14007 rupees
b) 10470 rupees
c) 14700 rupees
d) 14070 rupees
View Answer
Explanation: M is the selling price of article 1 and q is the selling price of article 5.
M:
The cost price of article = 12500 rupees
The marked price of the article = 12500 + 20% of 12500 = 12500 + 2500 = 15000
The discount allowed = 10%
The discount = 10% of the marked price = 10% of 15000 = 1500
The selling price = 15000 – 1500 = 13500
Q:
The cost price of article = 12200 rupees
The marked price of the article = 12200 + 50% of 12200 = 12200 + 6100 = 18300
The discount allowed = 20%
The discount = 20% of the marked price = 20% of 18300 = 3660
The selling price = 18300 – 3660 = 14640 rupees
The average of m and q = (13500 + 14640) / 2 = 14070 rupees
3. Study the table and find the value of P1 + P2 + P5.
| P | Q | R | S | T | ||
| 1 | 1000 | |||||
| 2 | 1250 | |||||
| 3 | 1500 | |||||
| 4 | 1750 | |||||
| 5 | 2000 |
P = 2 * the number
Q = P / 4
R = P + Q
S = P * Q
T = P / Q
a) 10500
b) 9500
c) 8500
d) 7500
View Answer
Explanation: P1 = 1000 * 2, P2 = 1250 * 2, P5 = 2000 * 2 = 2000, 2500, 4000
P1 + P2 + P3 = 2000 + 2500 + 4000 = 8500
4. Study the table and find the average height of all the boys and girls.
| Heights | 1 | 2 | 3 | 4 | 5 | 6 | 7 | 8 |
| Boys | 153 | 158 | 147 | 145 | 156 | 146 | 157 | 146 |
| Girls | 134 | 146 | 149 | 137 | 142 | 143 | 141 | 130 |
a) 145.625
b) 145.635
c) 145.5
d) 145.250
View Answer
Explanation: The average height of the boys and girls combined = (140.25 + 151) / 2 = 145.625
5. A’s weight is what percentage of the total weight of the results?
| A | B | C | D | E | F | G | H | I | |
| Age | 20 | 25 | 34 | 43 | 23 | 25 | 27 | 36 | 33 |
| Weight | 66 | 67 | 76 | 78 | 68 | 86 | 57 | 75 | 67 |
| Height | 143 | 141 | 145 | 142 | 147 | 149 | 152 | 139 | 140 |
a) 11.3%
b) 10%
c) 10.3%
d) 11%
View Answer
Explanation: The total weight = 66 + 67 + 76 + 78 + 68 + 86 + 57 + 75 + 67 = 640 units
A’s weight = 66 units
The required percentage = 66 / 640 * 100 = 10.31% ≈ 10.3 %
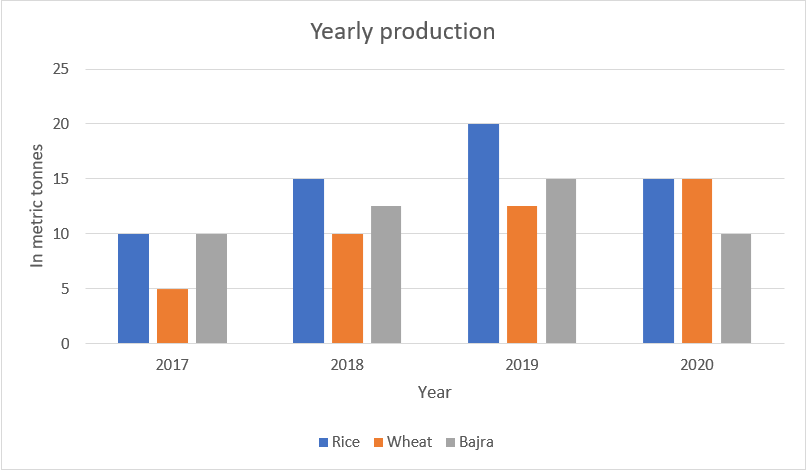
6. Production of wheat in 2019 and 2020 is what percentage of its production in 2018 and 2017?
a) 200%
b) 183.33%
c) 150%
d) 133.33%
View Answer
Explanation: The production of wheat in 2017 and 2018 = 5 + 10 = 15 tonnes
The production of wheat in 2019 and 2020 = 12.5 + 15 tonnes = 27.5 tonnes
The required percentage = 27.5 / 15 * 100 = 183.33%
7. Study the graph and find what is the ratio of average production of bajra to total production of rice?
a) 19 : 96
b) 17 : 94
c) 19 : 94
d) 17 : 96
View Answer
Explanation: The average production of bajra = (10 + 12.5 + 15 + 10) / 4 = 47.5 / 4 = 11.875 tonnes.
The total production of rice = 10 + 15 + 20 + 15 = 60 tonnes
The required ratio = 11.875 : 60 = 19 : 96
8. Study the table and find what percentage of A’s income is utilised in expenditure?
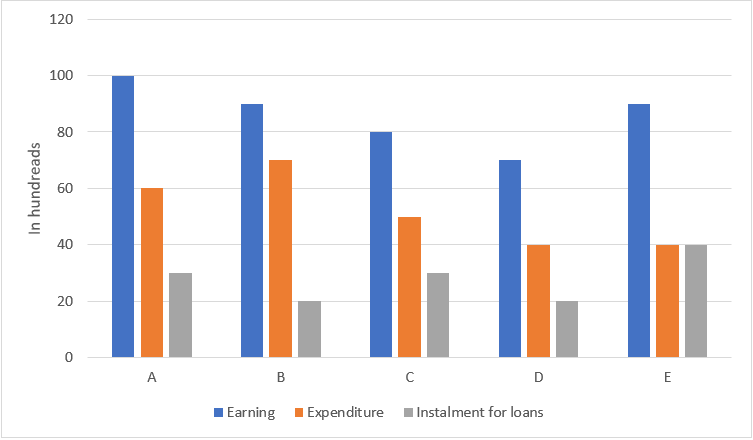
The chart represents monthly incomes of A, B, C, D and E.
a) 100%
b) 40%
c) 60%
d) 50%
View Answer
Explanation: The total income of A = 100
The expenditure of A = 60
The required percentage = 60 / 100 * 100 = 60% of his income
9. Study the table and find what is the average income of A, C and E?
The chart represents monthly incomes of A, B, C, D and E.
The chart represents monthly incomes of A, B, C, D and E.
a) 10000 rupees
b) 9500 rupees
c) 8500 rupees
d) 9000 rupees
View Answer
Explanation: The average income of A, C and E = (100 + 80 + 90) / 3 = 270 / 3 = 90 units = 90 * 100 = 9000 rupees
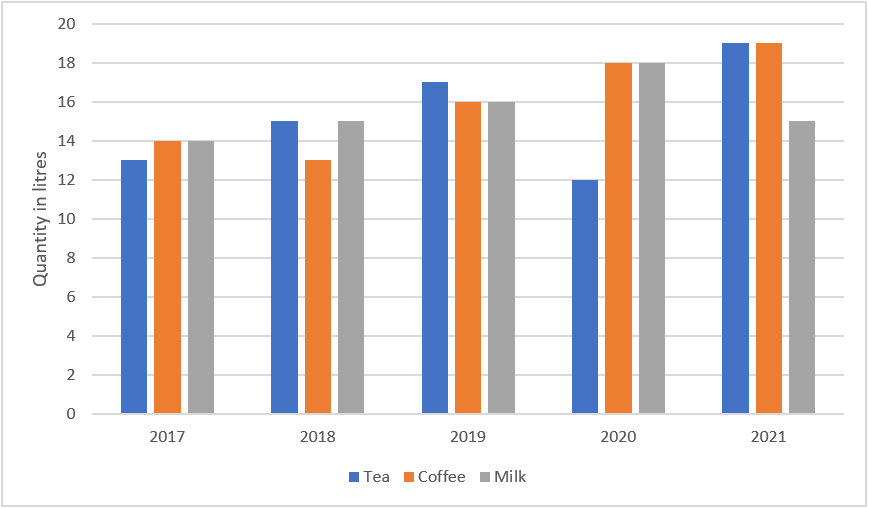
10. Study the graph and find what is the percentage increase in consumption of coffee from the year 2018 to the year 2019?
a) 23.07%
b) 32.70%
c) 32.07%
d) 23.70%
View Answer
Explanation: The Consumption of coffee in 2018 = 13 units
The consumption of coffee in the year 2019 = 16 units
The percentage increase = (16 – 13) / 13 * 100 = 3 / 13 * 100 = 23.07%
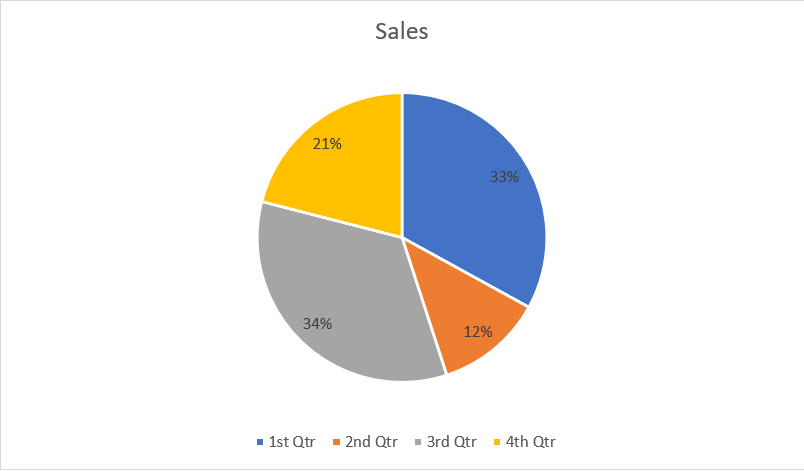
11. The yearly sales were 2,36,250 units, study the graph and find the sales in 3rd quarter.
a) 83025 units
b) 80325 units
c) 86250 units
d) 83265 units
View Answer
Explanation: The sales during the 3rd quarter = 236250 * 34 / 100 = 80325 units.
12. Study the graph and find what is the average quarterly sales throughout the year?
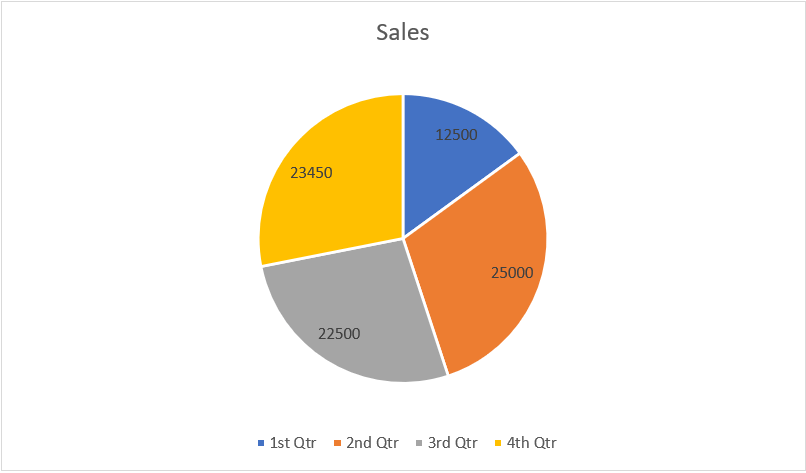
a) 20682.5 units
b) 20826.5 units
c) 20862.5 units
d) 20628.5 units
View Answer
Explanation: The average quarterly sales = (12500 + 22500 + 25000 + 23450) / 4 = 83450 / 4 = 20862.5 units quarterly.
13. Study the graph and find what is the angle of the sector of the 1st sector?
a) 58 degrees
b) 50 degrees
c) 62 degrees
d) 54 degrees
View Answer
Explanation: The angle of the sector of the 1st quarter = 15 / 100 * 360 = 54 degrees.
14. The sales in 1st quarter is to study the graph and find what percentage of the sales in the 3rd quarter?
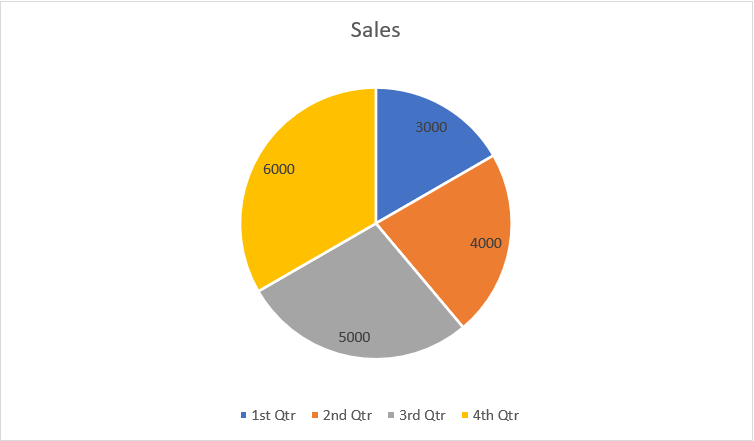
a) 60%
b) 55%
c) 66.66%
d) 63%
View Answer
Explanation: The sales in 1st quarter = 3000 units
The sales in 3rd quarter = 5000 units
The required percentage = 3000 / 5000 * 100 = 60%
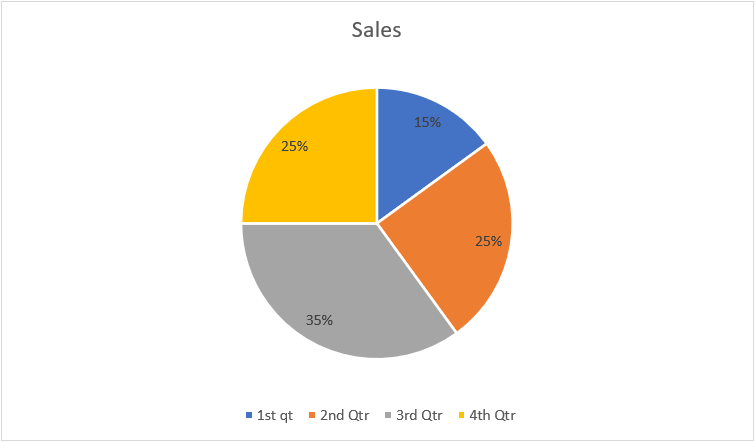
15. Study the graph and find the angle of the sector of the 4th quarter.
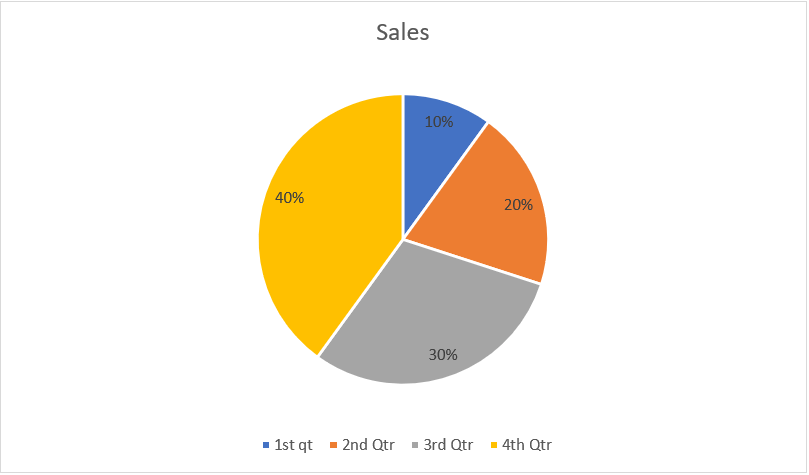
a) 118 degrees
b) 126 degrees
c) 132 degrees
d) 144 degrees
View Answer
Explanation: The angle of the sector of the 4th quarter = 40 / 100 * 360 = 144 degrees.
16. Study the graph and find what is the difference between the maximum sales of p and minimum sales of q?
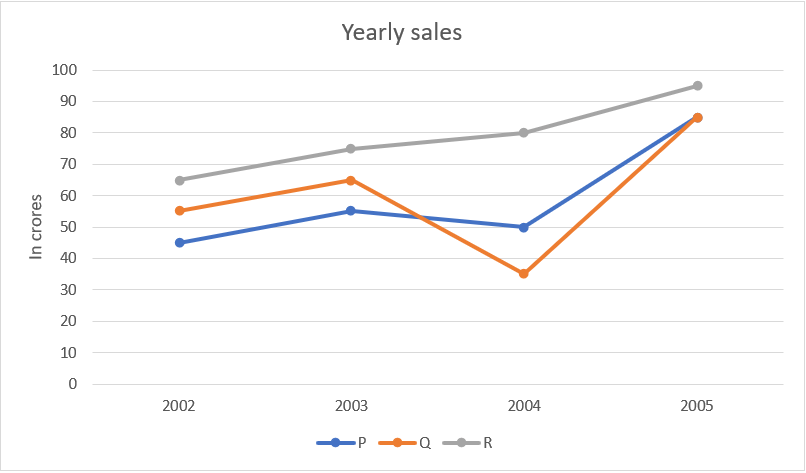
a) 55 crores
b) 50 crores
c) 45 crores
d) 40 crores
View Answer
Explanation: The maximum sales of p = 85 crores
The minimum sales of q = 35 crores
The difference = 85 – 35 = 50 crores
17. The sales of r in 2005 is what percentage of sales of p in 2004?
a) 52.63%
b) 180%
c) 190%
d) 47.75%
View Answer
Explanation: Th sales of r in 2005 = 95
The sales of p in 2004 = 50
The required percentage = 95 / 50 * 100 = 190%
18. Study the graph and find what is the total sales of p?
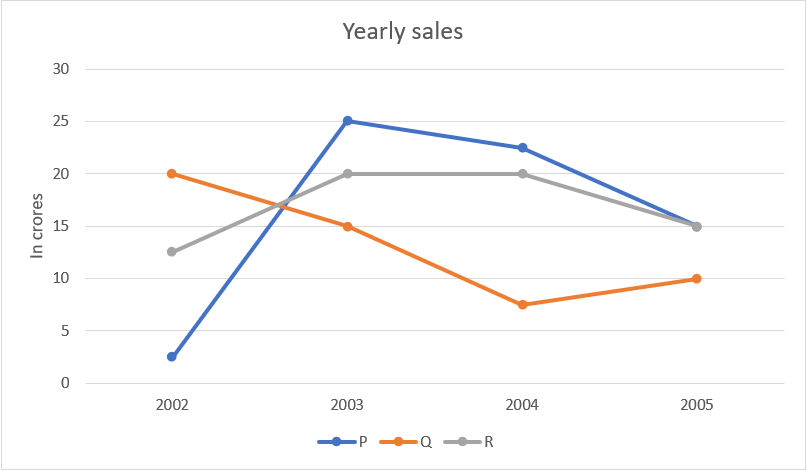
a) 75 crores
b) 80 crores
c) 55 crores
d) 65 crores
View Answer
Explanation: The total sales of p = 2.5 + 25 + 22.5 + 25 = 65 crores
19. The sales of p in 2004 is what percentage of the sales of q in 2002?
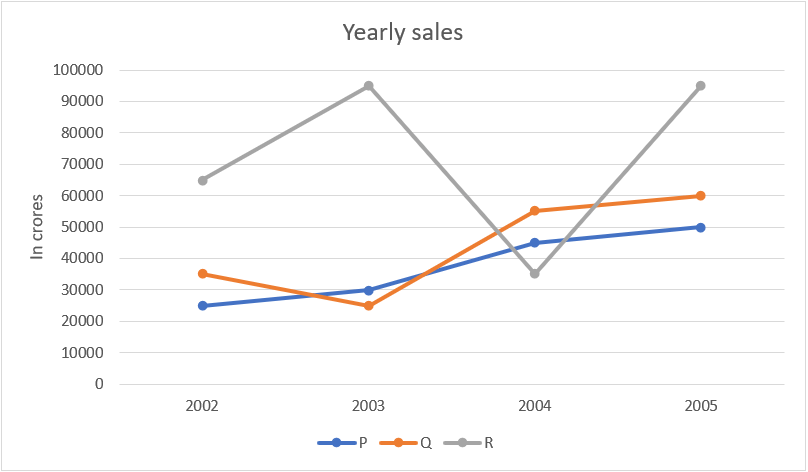
a) 128.57%
b) 188.88%
c) 125.7%
d) 112.5%
View Answer
Explanation: The sales of p in2004 = 45000 crores
The sales of q in 2002 = 35000 crores
The required percentage = 45000 / 35000 * 100 = 128.57%
20. Study the graph and find the maximum increase in production in terms of previous years in percentage.
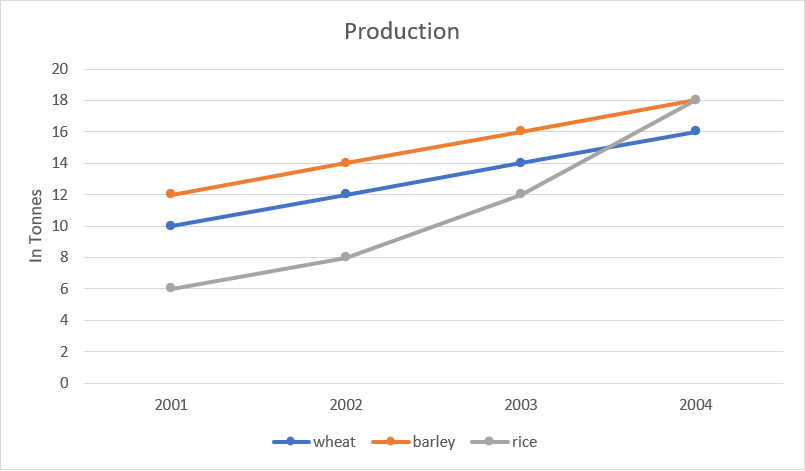
a) 66.66%
b) 50%
c) 33.33%
d) 40%
View Answer
Explanation: The maximum increase would be 50 tonnes or 50% increase in production of rice from year 2003 to year 2004.
Topic Wise Questions and Answers on Data Interpretation

Here is a list of Data Interpretation Topics:
1. Data Interpretation Questions on Tabulation
The section includes data interpretation questions and answers on tables.
|
|
|
2. Data Interpretation Questions and Answers on Bar Graphs
The section contains data interpretation questions on bar graphs
|
|
|
3. Data Interpretation Questions on Pie Chart
The section contains data interpretation questions and answers on pie charts.
|
|
|
4. Data Interpretation Questions and Answers on Line Graphs
The section contains data interpretation practice questions on line graphs.
|
|
|
5. Quantitative Aptitude
The section contains questions and answers on quantitative aptitude.
|
|
6. Logical Reasoning
The section contains questions and answers on logical reasoning.
|
|
Wish you the best in your endeavor to learn and master Data Interpretation!
If you find a mistake in question / option / answer, kindly take a screenshot and email to [email protected]
