This set of Verbal Reasoning Questions and Answers (MCQs) focuses on “Venn Diagram”. These questions are beneficial for various competitive exams, placement interviews, and entrance tests.
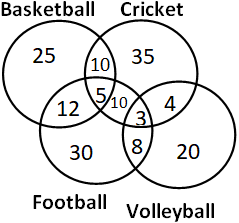
1. The following diagram shows the number of children playing Basketball, Cricket, Football and Volleyball. If the total number of children is 400, what is the percentage of children playing at least two games?
a) 8
b) 6
c) 9.25
d) 13
View Answer
Explanation: Number of children who play at least two games: –
10 + 5 + 10 + 3 + 4 + 12 + 8 = 52
Therefore, required percentage
= (52 ÷ 400) × 100 = 13%
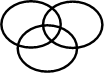
2. Which of the following diagram correctly represents the relationship among Teacher, Scientist and Graduate?
a)
b)

c)
d)
View Answer
Explanation: Some teachers can be scientist. Some graduates can be teacher or scientist.
Hence the diagram will be:

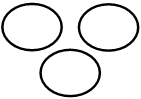
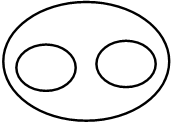
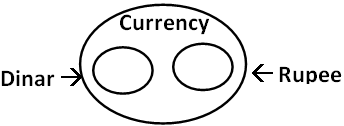
3. Which of the following diagram depicts the relation among Currency, Dinar and Rupee.
a)
b)
c)

d)
View Answer
Explanation: Dinar and Rupee both are currencies. But other currencies are also there. Dinar and Rupee are different currencies.
Hence, the diagram will be:
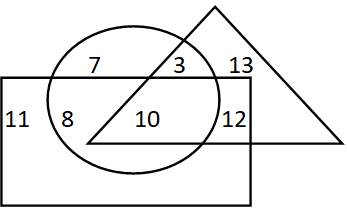
4. If triangle represents women, rectangle represents educated person and circle represent government jobs. Then which number represents educated women who are not in government job?
a) 10
b) 12
c) 8
d) 3
View Answer
Explanation: Here, the number for educated women not in government jobs should be common in triangle and rectangle but not in circle.
Hence, 12 is the answer.
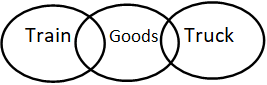
5. Which of the following figures shows relation between Trains, Goods and Truck?
a)
b)

c)

d)
View Answer
Explanation: Here, goods can be transported by trucks and trains as well as by other mode of transport also.
Hence, the diagram will be:-
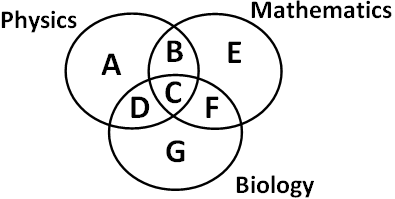
6. Which of the region in the following figure represents students who study both Physics and Mathematics but not Biology?
a) B + C + D + F
b) C
c) A + E
d) B
View Answer
Explanation: Here, region B represents the students who study both Physics and Mathematics but not Biology.
Hence B is the answer.
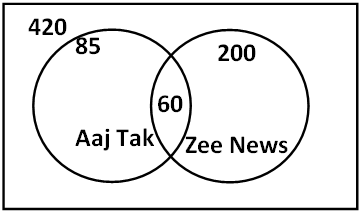
7. From the figure given below, determine the number of people who did not watch any news channel.
a) 135
b) 75
c) 195
d) 175
View Answer
Explanation: Here, the number of people who watch any news channel is: –
200 + 85 – 60 = 225
Since, total number of people is 420, therefore, the number of people who did not watch any news channel is: –
420 – 225 = 195
Hence, 195 is the answer.
8. Which of the following figures correctly represents the relation between Machine, Lathe and Thermodynamics?
a)
b)

c)
d)
View Answer
Explanation: Here, Lathe is a type of machine. But thermodynamics is entirely different from the two.
Hence, the diagram will be: –

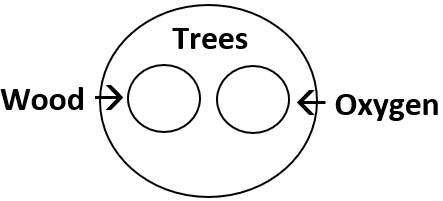
9. Which of the following diagram depicts the relation among Trees, Wood and Oxygen?
a)
b)
c)
d)
View Answer
Explanation: Here, wood and oxygen both are obtained by trees, but both are different.
Hence, the diagram will be:-
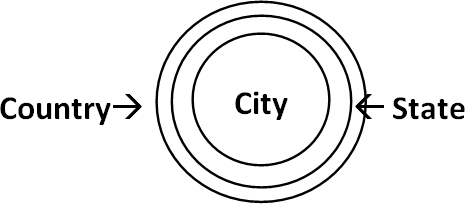
10. Which of the following figure correctly represents relation among Country, State and City?
a)
b)
c)
d)
View Answer
Explanation: Here, State comes under Country and City comes under State.
Hence, the diagram will be:-
More Verbal Reasoning Questions on Venn Diagram:
- Venn Diagram Questions (Set 2)
- Venn Diagram Questions (Set 3)
- Venn Diagram Questions (Set 4)
- Venn Diagram Questions (Set 5)
- Venn Diagram Questions (Set 6)
- Venn Diagram Questions (Set 7)
- Venn Diagram Questions (Set 8)
- Venn Diagram Questions (Set 9)
- Venn Diagram Questions (Set 10)
To practice all aptitude questions, please visit “1000+ Logical Reasoning Questions”, “1000+ Quantitative Aptitude Questions”, and “Data Interpretation Questions”.
If you find a mistake in question / option / answer, kindly take a screenshot and email to [email protected]
