This set of Data Interpretation Questions and Answers (MCQs) focuses on “Bar Graphs – Set 2”.
1. Study the table and find what is the monthly savings of A?
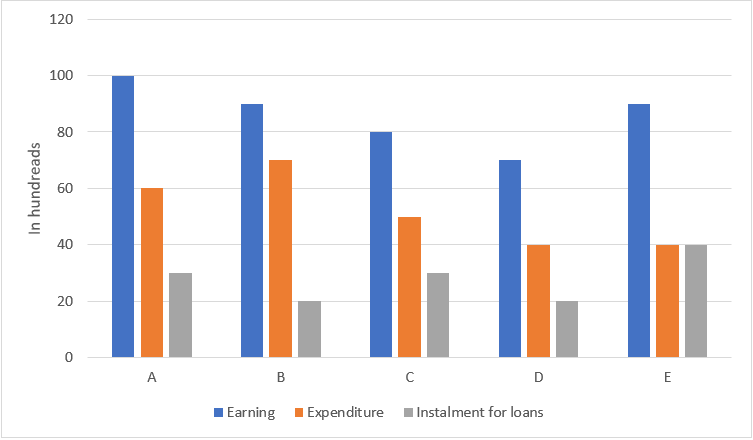
The chart represents monthly incomes of A, B, C, D and E.
a) 500 rupees
b) 1000 rupees
c) 5000 rupees
d) 100 rupees
View Answer
Explanation: The monthly savings of A = income – expenditure – instalment for loans = 100 – 60 – 30 = 10 = 10 * 100 = 1000 rupees
2. Study the table and find what percentage of A’s income is utilised in expenditure?
The chart represents monthly incomes of A, B, C, D and E.
a) 40%
b) 60%
c) 50%
d) 100%
View Answer
Explanation: The total income of A = 100
The expenditure of A = 60
The required percentage = 60 / 100 * 100 = 60% of his income
3. Study the table and find what is the ratio of A’s income to E’s Expenditure?
The chart represents monthly incomes of A, B, C, D and E.
a) 2 : 5
b) 5 : 2
c) 3 : 5
d) 5 : 3
View Answer
Explanation: A’s income = 100 units
E’s expenditure = 40 units
The required ratio = 100 : 40 = 5 : 2
4. Study the table and find what is the ratio of B’s income to C’s instalment of loan?
The chart represents monthly incomes of A, B, C, D and E.
a) 1 : 2
b) 2 : 1
c) 1 : 3
d) 3 : 1
View Answer
Explanation: B’s income = 90 units
C’s instalment = 30 units
The required ratio = 90 : 30 = 3 : 1
5. Study the table and find what is the total income of A, B and E?
The chart represents monthly incomes of A, B, C, D and E.
a) 20000 rupees
b) 25000 rupees
c) 28000 rupees
d) 30000 rupees
View Answer
Explanation: The total income of A, B and E = 100 + 90 + 90 = 280 units = 280 * 100 = 28000 rupees
6. Study the table and find what is the average income of A, C and E?
The chart represents monthly incomes of A, B, C, D and E.
The chart represents monthly incomes of A, B, C, D and E.
a) 8500 rupees
b) 9000 rupees
c) 9500 rupees
d) 10000 rupees
View Answer
Explanation: The average income of A, C and E = (100 + 80 + 90) / 3 = 270 / 3 = 90 units = 90 * 100 = 9000 rupees
7. Study the table and find what is the total savings of A, B, C and E?
The chart represents monthly incomes of A, B, C, D and E.
a) 2000 rupees
b) 3000 rupees
c) 4000 rupees
d) 5000 rupees
View Answer
Explanation: The total savings of A, B, C and E = (100 + 90 + 80 + 90) – (60 + 30 + 70 + 20 + 50 + 30 + 40 + 40) = 360 – 340 = 20 units = 20 * 100 = 2000 rupees
8. Study the table and find what is the total expenditure of A, B, C, D and E?
The chart represents monthly incomes of A, B, C, D and E.
a) 24000 rupees
b) 26000 rupees
c) 30000 rupees
d) 35000 rupees
View Answer
Explanation: The total Expenditure of A, B, C, D and E. = 60 + 70 + 50 + 40 + 40 = 260 units = 260 * 100 = 26000 rupees
9. Study the table and find what is the total savings of A, B and C?
The chart represents monthly incomes of A, B, C, D and E.
a) 1000 rupees
b) 2000 rupees
c) 2500 rupees
d) 3000 rupees
View Answer
Explanation: The total savings of A, B and C = (100 + 90 + 80) – (60 + 30 + 70 + 20 + 50 + 30) = 270 – 260 = 10 units = 10 * 100 = 1000 rupees.
10. A’s Expenditure is what percentage of E’s instalment for loan?
The chart represents monthly incomes of A, B, C, D and E.
a) 33.33%
b) 66.66%
c) 100%
d) 150%
View Answer
Explanation: A’s expenditure = 60 units
E’s instalment for loan = 40 units
The required percentage = 40 / 60 * 10 = 66.66%
To practice all aptitude questions, please visit “Data Interpretation Questions”, “1000+ Quantitative Aptitude Questions”, and “1000+ Logical Reasoning Questions”.
If you find a mistake in question / option / answer, kindly take a screenshot and email to [email protected]
