This set of Data Interpretation Questions and Answers (MCQs) focuses on “Line Graphs – Set 3”.
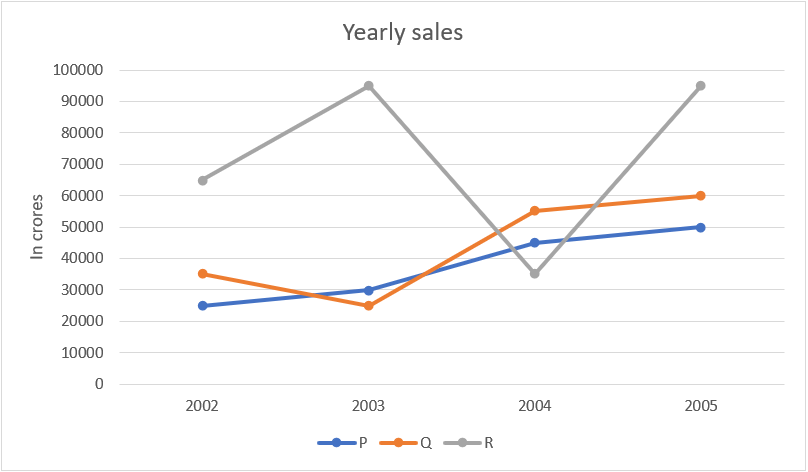
1. Study the graph and find what is the difference between maximum and minimum sales of p.
a) 22500 crores
b) 25000 crores
c) 27500 crores
d) 35000 crores
View Answer
Explanation: The difference between the maximum and minimum sales :
The maximum sales = 50000 crores
The minimum sales = 25000 crores
The difference = 50000 – 25000 = 25000 crores
2. Study the graph and find what is the difference between the maximum sales of p and minimum sales of q?
a) 12500 crores
b) 15000 crores
c) 25000 crores
d) 20000 crores
View Answer
Explanation: The maximum sales of p = 50000 crores
The minimum sales of q = 25000 crores
The difference = 50000 – 25000 = 25000 crores
3. Find the total sales of p an r in the year 2003 and 2004.
a) 250000 crores
b) 205000 crores
c) 200500 crores
d) 205050 crores
View Answer
Explanation: The total sales = 30000 + 95000 + 35000 + 45000 = 205000 crores
4. The sales of p in 2004 is what percentage of the sales of q in 2002?
a) 112.5%
b) 125.7%
c) 128.57%
d) 188.88%
View Answer
Explanation: The sales of p in2004 = 45000 crores
The sales of q in 2002 = 35000 crores
The required percentage = 45000 / 35000 * 100 = 128.57%
5. The sales of r in 2005 is Study the graph and find what percentage of sales of p in 2004?
a) 111.11%
b) 211.11%
c) 288.88%
d) 322.22%
View Answer
Explanation: Th sales of r in 2005 = 95000
The sales of p in 2004 = 45000
The required percentage = 95000 / 45000 * 100 = 211.11%
6. Study the graph and find what is the total sales of p?
a) 145000 crores
b) 150000 crores
c) 165000 crores
d) 180000 crores
View Answer
Explanation: The total sales of p = 25000 + 30000 + 45000 + 50000 = 150000 crores
7. Study the graph and find what is the total sales of p, q, and r in 2004?
a) 135000 crores
b) 150000 crores
c) 165000 crores
d) 140000 crores
View Answer
Explanation: The total sales of p, q and r in 2004 = 45000 + 55000 + 35000 = 135000 crores
8. Study the graph and find what is the ratio of p’s sales in 2004 and q’s sales in 2005?
a) 2 : 3
b) 1 : 3
c) 3 : 4
d) 1 : 4
View Answer
Explanation: P’s sales in 2004 = 45000
Q’s sales in 2005 = 60000
The required ratio = 45000 : 60000 = 3 : 4
9. Study the graph and find what is the ratio of p’s sales to r’s sales?
a) 14 : 27
b) 15 : 29
c) 16 : 31
d) 21 : 29
View Answer
Explanation: P’s sales 25000 + 30000 + 45000 + 50000 = 150000 crores
R’s sales = 65000 + 95000 + 35000 + 95000 = 290000 crores
The required ratio = 150000 : 290000 = 15 : 29
10. Study the graph and find what is the total sales of p, q and r in 2004 and 2005?
a) 290000 crores
b) 340000 crores
c) 370000 crores
d) 410000 crores
View Answer
Explanation: The total sales of p, q and r in 2004 and 2005 = 45000 + 55000 + 35000 + 50000 + 60000 + 95000 = 340000 crores
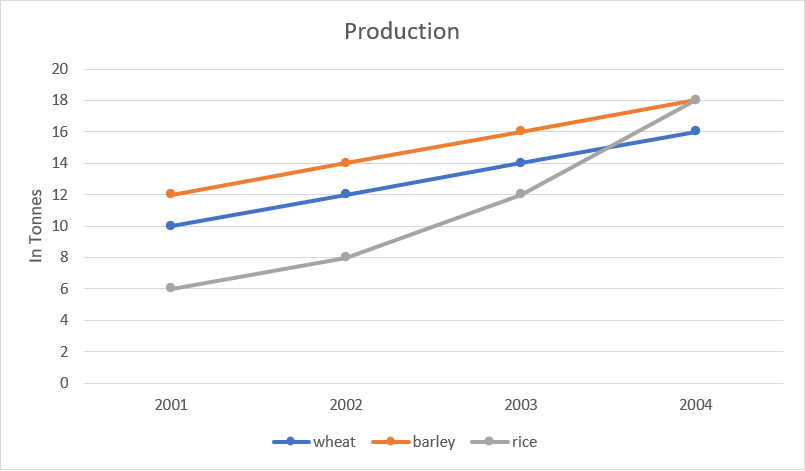
11. Study the graph and find the maximum increase in production in terms of previous years in percentage.
a) 33.33%
b) 40%
c) 50%
d) 66.66%
View Answer
Explanation: The maximum increase would be 50 tonnes or 50% increase in production of rice from year 2003 to year 2004.
12. Study the graph and find what is the average production of rice throughout the years?
a) 10 tonnes
b) 11 tonnes
c) 13 tonnes
d) 14 tonnes
View Answer
Explanation: The average production = (6 + 8 + 12 + 18) / 4 = 44 / 4 = 11 tonnes
13. Study the graph and find what is the average production of all the three crops in 2001?
a) 6.66 tonnes
b) 6.33 tonnes
c) 9.99 tonnes
d) 9.33 tonnes
View Answer
Explanation: The average production = (6 + 10 + 12) / 3 = 9.33 tonnes
14. Study the graph and find what is the percentage growth in rice’s production from 2001 to 2004?
a) 33.33% growth
b) 66.66% growth
c) 120% growth
d) 200% growth
View Answer
Explanation: The percentage growth = 12 / 6 * 100 = 200% growth
15. Study the graph and find what is the percentage growth of barley’s production from 2002 to 2003?
a) 7.14%
b) 14.28%
c) 21.42%
d) 28.56%
View Answer
Explanation: The percentage growth = 2 / 14 * 100 = 14.28%
16. Study the graph and find what is the percentage growth of wheat from 2001 to 2003?
a) 28.56% growth
b) 57.12% growth
c) 40% growth
d) 60% growth
View Answer
Explanation: The percentage growth = 4 / 10 * 100 = 40% growth
17. Study the graph and find what is the minimum percentage growth for any of the three crops over the previous year?
a) 10% growth
b) 12.5% growth
c) 15% growth
d) 16% growth
View Answer
Explanation: The minimum percentage growth is of barley for the year 2003 – 2004
The percentage = 2 / 16 * 100 = 12.5% growth
18. Study the graph and find what is the percentage growth to produce wheat from 2001 to 2002?
a) 20% growth
b) 30% growth
c) 33.33% growth
d) 40% growth
View Answer
Explanation: The growth percentage = 2 / 10 * 100 = 20% growth
19. Study the graph and find what is wheat’s total production in terms of barley’s production in 2003?
a) 32.5%
b) 325%
c) 307%
d) 30.7%
View Answer
Explanation: Wheat’s total production = 10 + 12 + 14 + 16 = 52 tonnes
Barley’s production in 2003 = 16 tonnes
The required percentage = 52 / 16 * 100 = 325%
20. Study the graph and find what is the average production of barley throughout the time?
a) 11 tonnes
b) 12 tonnes
c) 13 tonnes
d) 15 tonnes
View Answer
Explanation: The average production of barley throughout the time = (12 + 14 + 16 + 18) / 4 = 60 / 4 = 15 tonnes
To practice all aptitude questions, please visit “Data Interpretation Questions”, “1000+ Quantitative Aptitude Questions”, and “1000+ Logical Reasoning Questions”.
If you find a mistake in question / option / answer, kindly take a screenshot and email to [email protected]
