This set of Data Interpretation Questions and Answers (MCQs) focuses on “Bar Graphs – Set 3”.
1. Study the graph and find what is the maximum percentage increase of tea from previous year to next year?
a) 40%
b) 58.33%
c) 60%
d) 77.77%
View Answer
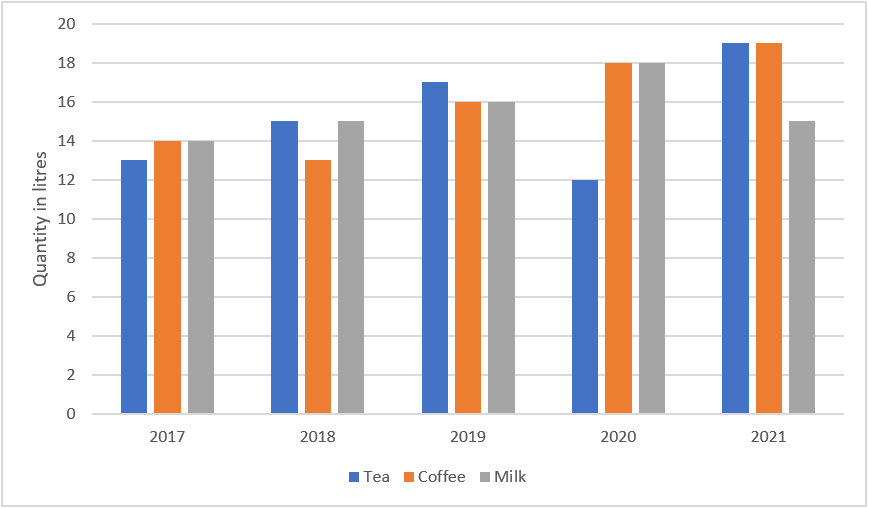
Explanation: The maximum percentage increase is from the year 2020 to 2021.
The increase percentage:
The consumption of tea in 2020 = 12 litres
The consumption of tea in 2021 = 19 litres
The increase = 19 – 12 = 7 litres
The percentage increase = 7 / 12 * 100 = 58.33%
2. Study the graph and find what is the ratio of tea consumed in 2021 to milk consumed throughout the time?
a) 1 : 4
b) 19 : 78
c) 19 : 86
d) 19 : 98
View Answer
Explanation: tea consumed in 2021 = 19 units
Milk consumed throughout the time = 14 + 15 + 16 + 18 + 15 = 78
The required ratio = 19 : 78
3. Study the graph and find what is the Ratio of consumption of coffee in 2018 and 2021 to the consumption of tea in 2017 and 2019?
a) 33 : 31
b) 34 : 30
c) 35 : 29
d) 36 : 28
View Answer
Explanation: The consumption of coffee in 2018 and 2021 = 15 + 19 = 34 units
The consumption of tea in 2017 and 2019 = 13 + 17 = 30 units
The required ratio = 34 : 30
4. Study the graph and find what is the percentage increase in consumption of coffee from the year 2018 to the year 2019?
a) 23.70%
b) 23.07%
c) 32.70%
d) 32.07%
View Answer
Explanation: The Consumption of coffee in 2018 = 13 units
The consumption of coffee in the year 2019 = 16 units
The percentage increase = (16 – 13) / 13 * 100 = 3 / 13 * 100 = 23.07%
5. Study the graph and find what is the percentage increase in the consumption of milk in 2017 to the year 2021?
a) 7.14%
b) 14.28%
c) 7.28%
d) 14.14%
View Answer
Explanation: The consumption of milk in 2017 = 14 units
The consumption of milk in the year 2018 = 15 units
The percentage increase = (15 – 14) / 14 * 100 = 1 / 14 * 100 = 7.14%
6. Study the graph and find what is the percentage increase in the consumption of coffee from the year 2018 to the year 2020?
a) 45.65%
b) 46.15%
c) 47.85%
d) 49.95%
View Answer
Explanation: The consumption of coffee in 2018 = 13 units
The consumption of coffee in the year 2020 = 19 units
The change percentage = (19 – 13) / 13 * 100 = 6 / 13 * 100 = 46.15%
7. Study the graph and find what is the average consumption of coffee in the year 2019, 2020 and 2021?
a) 16.66 litres
b) 17.66 litres of coffee
c) 18.66 litres of coffee
d) 19.66 litres of coffee
View Answer
Explanation: The average consumption of coffee in the year 2019, 2020 and 2021 = (16 + 18 + 19) / 3 = 53 / 3 = 17.66 litres of coffee.
8. Study the graph and find what is the average yearly consumption of milk?
a) 14.5 litres
b) 15.6 litres
c) 17.8 litres
d) 14.4 litres
View Answer
Explanation: The average yearly consumption of milk = (14 + 15 + 16 + 18 + 15) / 5 = 78 / 5 = 15.6 litres yearly.
9. Study the graph and find what is the average monthly consumption of tea throughout the years?
a) 15.2 litres
b) 1.26 litres
c) 1.52 litres
d) 12.6 litres
View Answer
Explanation: The average monthly consumption of tea = (13 + 15 + 17 + 12 + 19) / (5 * 12) = 76 / 60 = 1.26 litres
10. Study the graph and find what is the ratio of monthly consumption of tea to monthly consumption of coffee?
a) 20 : 19
b) 19 : 20
c) 17 : 18
d) 18 : 17
View Answer
Explanation: The average monthly consumption of tea = (13 + 15 + 17 + 12 + 19) / (5 * 12) = 76 / 60 litres
The average monthly consumption of coffee = (14 + 13 + 16 + 18 + 19) / (5 * 12) = 80 / 60 litres
The required ratio = 76 / 60 : 80 / 60 = 76 : 80 = 19 : 20
To practice all aptitude questions, please visit “Data Interpretation Questions”, “1000+ Quantitative Aptitude Questions”, and “1000+ Logical Reasoning Questions”.
If you find a mistake in question / option / answer, kindly take a screenshot and email to [email protected]
