This set of Data Interpretation Questions and Answers (MCQs) focuses on “Line Graphs – Set 2”.
1. Study the graph and find what is the difference between maximum and minimum sales of p.
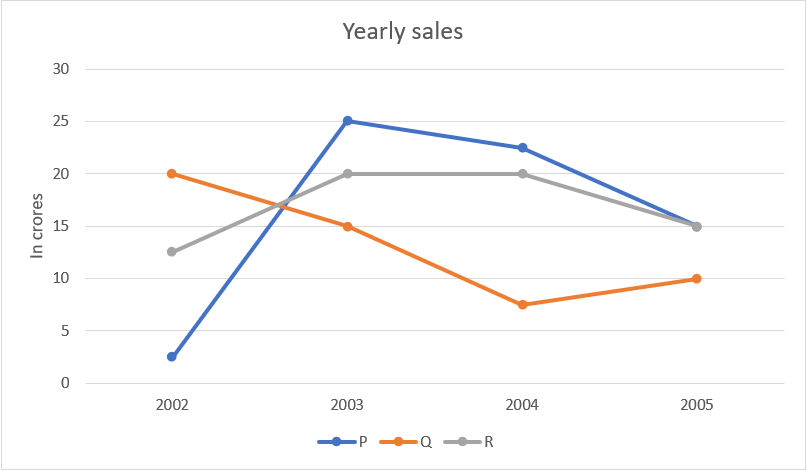
a) 22.5 crores
b) 25 crores
c) 27.5 crores
d) 35 crores
View Answer
Explanation: The difference between the maximum and minimum sales:
The maximum sales = 25 crores
The minimum sales = 2.5 crores
The difference = 25 – 2.5 = 22.5 crores
2. Study the graph and find what is the difference between the maximum sales of p and minimum sales of q?
a) 12.5 crores
b) 15 crores
c) 17.5 crores
d) 20 crores
View Answer
Explanation: The maximum sales of p = 25 crores
The minimum sales of q = 7.5 crores
The difference = 25 – 7.5 = 17.5 crores
3. Study the graph and find the total sales of p an r in the year 2003 and 2004.
a) 85 crores
b) 87.5 crores
c) 97 crores
d) 97.5 crores
View Answer
Explanation: The total sales = 25 + 20 + 20 + 22.5 = 87.5 crores
4. The sales of p in 2004 is what percentage of the sales of q in 2002?
a) 100%
b) 111.11%
c) 112.5%
d) 88.88%
View Answer
Explanation: The sales of p in2004 = 22.5 crores
The sales of q in 2002 = 20 crores
The required percentage = 22.5 / 20 * 100 = 112.5%
5. The sales of r in 2005 is what percentage of sales of p in 2004?
a) 33.33%
b) 66.66%
c) 54.54%
d) 70%
View Answer
Explanation: Th sales of r in 2005 = 15
The sales of p in 2004 = 22.5
The required percentage = 15 / 22.5 * 100 = 66.66%
6. Study the graph and find what is the total sales of p?
a) 55 crores
b) 65 crores
c) 75 crores
d) 80 crores
View Answer
Explanation: The total sales of p = 2.5 + 25 + 22.5 + 25 = 65 crores
7. Study the graph and find what is the total sales of p, q, and r in 2004?
a) 35 crores
b) 50 crores
c) 65 crores
d) 40 crores
View Answer
Explanation: The total sales of p, q and r in 2004 = 22.5 + 7.5 + 20 = 50 crores
8. Study the graph and find what is the ratio of p’s sales in 2004 and q’s sales in 2005?
a) 9 : 4
b) 10 : 3
c) 11 : 5
d) 6 : 1
View Answer
Explanation: P’s sales in 2004 = 22.5
Q’s sales in 2005 = 10
The required ratio = 22.5 : 10 = 9 : 4
9. Study the graph and find what is the ratio of p’s sales to r’s sales?
a) 24 : 25
b) 25 : 26
c) 26 : 27
d) 27 : 28
View Answer
Explanation: P’s sales 2.5 + 25 + 22.5 + 25 = 65 crores
R’s sales = 12.5 + 20 + 20 + 15 = 67.5 crores
The required ratio = 65 : 67.5 = 26 : 27
10. Study the graph and find what is the total sales of p, q and r in 2004 and 2005?
a) 70 crores
b) 80 crores
c) 90 crores
d) 100 crores
View Answer
Explanation: The total sales of p, q and r in 2004 and 2005 = 22.5 + 20 + 7.5 + 15 + 15 + 10 = 80 crores
To practice all aptitude questions, please visit “Data Interpretation Questions”, “1000+ Quantitative Aptitude Questions”, and “1000+ Logical Reasoning Questions”.
If you find a mistake in question / option / answer, kindly take a screenshot and email to [email protected]
