This set of Data Interpretation Questions and Answers (MCQs) focuses on “Line Graphs”. These questions are beneficial for various competitive exams, placement interviews, and entrance tests.
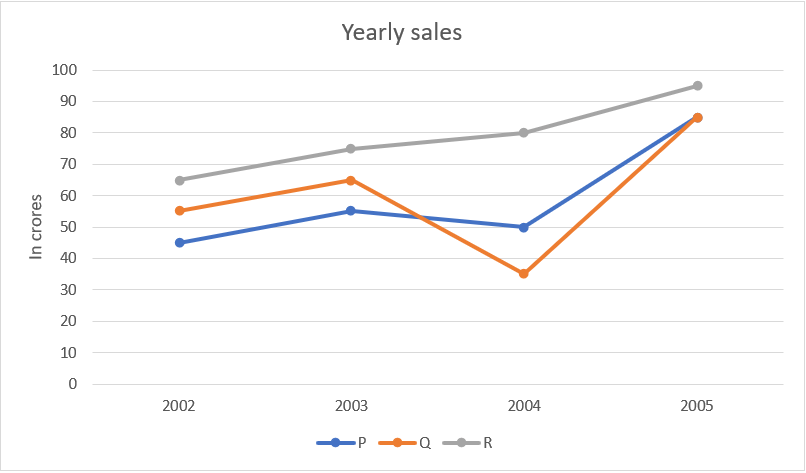
1. Study the graph and find what is the difference between maximum and minimum sales of p.
a) 40 crores
b) 45 crores
c) 50 crores
d) 55 crores
View Answer
Explanation: The difference between the maximum and minimum sales:
The maximum sales = 85 crores
The minimum sales = 45 crores
The difference = 85 – 45 = 40 crores
2. Study the graph and find what is the difference between the maximum sales of p and minimum sales of q?
a) 40 crores
b) 45 crores
c) 50 crores
d) 55 crores
View Answer
Explanation: The maximum sales of p = 85 crores
The minimum sales of q = 35 crores
The difference = 85 – 35 = 50 crores
3. Study the graph and find the total sales of p an r in the year 2003 and 2004.
a) 250 crores
b) 260 crores
c) 270 crores
d) 275 crores
View Answer
Explanation: The total sales = 75 + 80 + 55 + 50 = 260 crores
4. The sales of p in 2004 is what percentage of the sales of q in 2002?
a) 110%
b) 11.11%
c) 90.90%
d) 95%
View Answer
Explanation: The sales of p in2004 = 50 crores
The sales of q in 2002 = 55 crores
The required percentage = 50 / 55 * 100 = 90.90%
5. The sales of r in 2005 is what percentage of sales of p in 2004?
a) 180%
b) 190%
c) 47.75%
d) 52.63%
View Answer
Explanation: Th sales of r in 2005 = 95
The sales of p in 2004 = 50
The required percentage = 95 / 50 * 100 = 190%
6. Study the graph and find what is the total sales of p?
a) 225 crores
b) 235 crores
c) 245 crores
d) 250 crores
View Answer
Explanation: The total sales of p = 45 + 55 + 50 + 85 = 235 crores
7. Study the graph and find what is the total sales of p, q and r in 2004?
a) 135 crores
b) 150 crores
c) 165 crores
d) 200 crores
View Answer
Explanation: The total sales of p, q and r in 2004 = 50 + 35 + 80 = 165 crores
8. Study the graph and find what is the ratio of p’s sales in 2004 and q’s sales in 2005?
a) 9 : 16
b) 10 : 17
c) 11 : 18
d) 12 : 10
View Answer
Explanation: P’s sales in 2004 = 50
Q’s sales in 2005 = 85
The required ratio = 50 : 85 = 10 : 17
9. Study the graph and find what is the ratio of p’s sales to r’s sales?
a) 45 : 61
b) 46 : 63
c) 47 : 63
d) 49 : 66
View Answer
Explanation: P’s sales = 45 + 55 + 50 + 85 = 235 crores
R’s sales = 65 + 75 + 80 + 95 = 315 crores
The required ratio = 235 : 315 = 47 : 63
10. Study the graph and find what is the total sales of p, q and r in 2004 and 2005?
a) 420 crores
b) 430 crores
c) 440 crores
d) 450 crores
View Answer
Explanation: The total sales of p, q and r in 2004 and 2005 = 50 + 35 + 80 + 85 + 85 + 95 = 430 crores
More Data Interpretation Questions and Answers on Line Graphs:
To practice all aptitude questions, please visit “Data Interpretation Questions”, “1000+ Quantitative Aptitude Questions”, and “1000+ Logical Reasoning Questions”.
If you find a mistake in question / option / answer, kindly take a screenshot and email to [email protected]
