This set of Probability Multiple Choice Questions & Answers (MCQs) focuses on “Probability Distributions – Set 3”.
1. For which of the following conditions does the Geometric Random Variable P[X=n] = (1-p)n-1p, hold?
a) Independent trials and n=0, 1, 2, 3, …
b) Independent trials and n=1, 2, 3, …
c) Dependent trials and n=0, 1, 2, 3, …
d) Dependent trials and n=1, 2, 3, …
View Answer
Explanation: The Geometric random variable always holds for independent trials and not dependent trials. It should also not start with 0. Hence the condition will hold for n=1, 2, 3 …
2. F(x) = (1/2)e-|x|, -∞<x<∞, is a possible probability density function.
a) True
b) False
View Answer
Explanation: |x| is an even function;
|x|=x for all x≥0;
so, \(\int_{-∞}^{∞}f(x)dx=\int_{-∞}^{∞}e^{-|x|} dx = \int_{0}^{∞}e^{-x} dx=1,f(x)≥0,∀x\).
3. The set of points of discontinuity of a distribution function is __________
a) at least nonenumerable
b) at most nonenumerable
c) at least enumerable
d) at most enumerable
View Answer
Explanation: Any discontinuity in the distribution function can be mapped to a disjoint interval. The length of the interval is bound and hence countable. Thus the discontinuities are also countable i.e. enumerable.
4. The curve y=f(x) is called the distribution curve of the corresponding random variable x. It is evident that the distribution curve lies between ____________
a) Y=0, X=0
b) Y=0, X=1
c) Y=0, Y=1
d) X=0, X=1
View Answer
Explanation: Y is the distribution curve. Hence, it displays the probability of finding a certain point X. Therefore, Y can take any value between 0 and 1. Thus the curve lies between y=0 and y=1.
5. The number of changes of a stochastic process in a given interval of time follows _____________ law under certain conditions.
a) binomial
b) poisson
c) gamma
d) beta
View Answer
Explanation: The stochastic process can be represented as a counting process that displays a random number of points or events that have occurred until a particular time. The number of changes in the given interval is a Poisson variable dependent on time and another parameter.
6. The following is a probability mass function.
F(x)=\(\begin{Bmatrix}2 \,for \,x=\frac{1}{2}\\1 \,for \,x=\frac{1}{4}\\-1 \,for \,x=\frac{3}{4}\\0,elsewhere \end{Bmatrix}\)
a) True
b) False
View Answer
Explanation: f(\(\frac{3}{4}\)) = -1 < 0;
A probability function has to take values between 0 and 1 i.e. it can never be -1. Thus, f(x) is not a probability mass function.
7. For a two dimensional distribution function F(x, y), F(x, y) is ____________ for both the variable x and y.
a) monotonically decreasing
b) monotonically non-decreasing
c) monotonically increasing
d) monotonically non-increasing.
View Answer
Explanation: Let F(x, y), be denoted as a. Now, suppose a is positive. Then the 2-D function F(x, y), F(x, y) is also positive. Now, if a is negative, then a*a has to be positive. Thus again, F(x, y), F(x, y) is positive irrespective of the variables and the function.
8. The random variable is uniformly distributed in (0, 1). Then the probability distribution of Y = -2 logeX is ____________
a) Fy(y)=\(\frac{1}{2} e^{\frac{-1}{2} y}\), 0<y<∞
b) Fy(y)=\(\frac{1}{2} e^{\frac{1}{2} y}\), 0<y<∞
c) Fx(y)=\(\frac{1}{2} e^{\frac{-1}{2} y}\), 0<y<∞
d) Fy(y)=\(\frac{1}{2} e^{\frac{-1}{2}}\), 0<y<∞
View Answer
Explanation: Differentiating Y = -2 logeX, we get \(\frac{dy}{dx}=\frac{-2}{x}\). Now, \(\frac{dy}{dx}=\frac{-2}{x}\) <0 ∀x∈(0,1)
Hence, Fy(y) = Fx(x)\(|\frac{dy}{dx}|\) i.e. Fy(y)=\(\frac{1}{2} e^{{-1}{2} y}\),0<y<∞
9. The salary of workers in a factory follows a binomial (300, 1/6) distribution. What will be the mean and standard deviation of the distribution curve?
a) 40, 41.6
b) 40, 6.4
c) 50, 41.6
d) 50, 6.4
View Answer
Explanation: For a binomial (n, p) distribution, the mean is (n*p) and the standard deviation is the square root of (n*p*(1-p)).
Now, n = 300, p = 1/6, 1-p = 5/6
Mean = (n*p) = 300 * 1/6 = 50
SD = square root of (50 * 5/6) = 6.4.
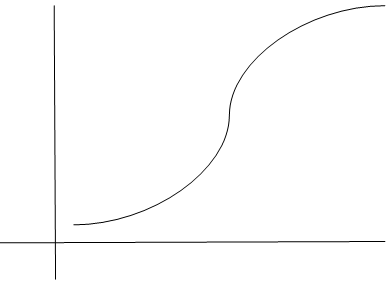
10. The graph of the standard normal distribution curve is?
a)
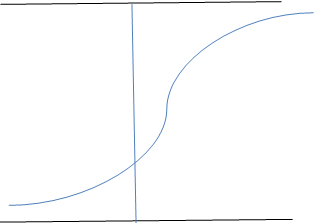
b)
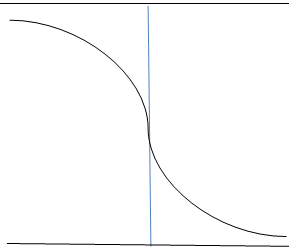
c)
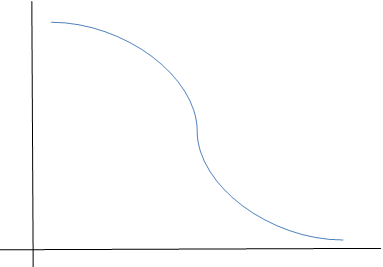
d)
View Answer
Explanation: For every standard normal distribution curve, the standard deviation has to be 1 and the mean or the average of points has to be zero. Thus, the curve must pass through the y-axis in the middle of the curve. Only curve (b) passes through the y-axis in the middle of the curve.
Sanfoundry Global Education & Learning Series – Probability and Statistics.
To practice all areas of Probability and Statistics, here is complete set of 1000+ Multiple Choice Questions and Answers.
If you find a mistake in question / option / answer, kindly take a screenshot and email to [email protected]
- Practice Numerical Methods MCQ
- Practice Engineering Mathematics MCQ
- Check Probability and Statistics Books
- Apply for 1st Year Engineering Internship
