This set of Data Mining Multiple Choice Questions & Answers (MCQs) focuses on “Data Visualization”.
1. Which of the following is not a basic unit used in digital image technology?
a) Picture element
b) Pixel
c) Pel
d) Dimension
View Answer
Explanation: In digital image technology, picture element is the smallest addressable basic unit. It is also known by the name pixel as a shorter version. An even shorter version by which the picture element is referred to is pel.
2. In dimension visualization, which property of the pixel represents the value of the dimension?
a) Color
b) Size
c) Density
d) Opacity
View Answer
Explanation: Picture element, also known as pixel, is the smallest addressable point in the raster display. The color of the pixel is used as a property to represent a dimension’s value, which is being visualized.
3. In how many windows is the screen divided by the pixel oriented techniques when visualizing a data set with m dimensions?
a) 2m
b) m/2
c) m
d) 3m
View Answer
Explanation: In pixel oriented techniques, for a data set of m dimensions, the screen is divided into m windows, with each window representing one of the dimensions. Each dimension value is mapped to its corresponding pixel value on the screen.
4. Which of the following is not a 2-D space filling curve?
a) Gray code
b) Z-curve
c) Hilbert curve
d) Frequency curve
View Answer
Explanation: Space filling curves address the problems caused by linear arrangement of pixels. The range of a space filling curve covers the entire hypercube of n dimensions. Some of the space filling curves are- Gray code, Z-curve and Hilbert curve.
5. Which of the following is not the preferred shape of the window in pixel oriented techniques?
a) Rectangle
b) Circle
c) Triangle
d) No compulsion on shape of window
View Answer
Explanation: Pixel oriented techniques divide the screen into windows according to the dimensions that have to be represented. There is no preferred shape of the window. It can be rectangle, circle, triangle or some other shape as per the preferences of the user.
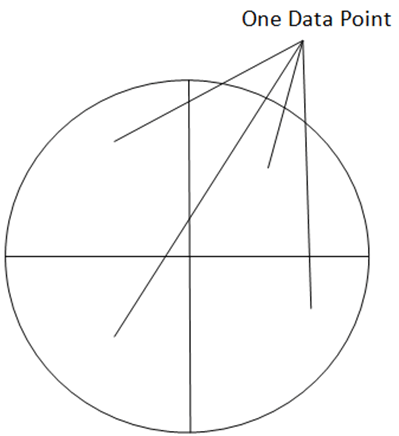
6. How many dimensions does the following space filling curve visualize?
a) One dimension
b) Two dimensions
c) Three dimensions
d) Four dimensions
View Answer
Explanation: Space filling curves are used to address the disadvantages of linear arrangement of pixels. They can be of different shapes. The given space filling curve represents four dimensions with each recording one data point.
7. Geometric projection techniques visualize high dimension space on a 2-D space.
a) True
b) False
View Answer
Explanation: The pixel oriented techniques do not represent multidimensional data well. The geometric projection techniques address these problems and try to represent patterns in multidimensional data.
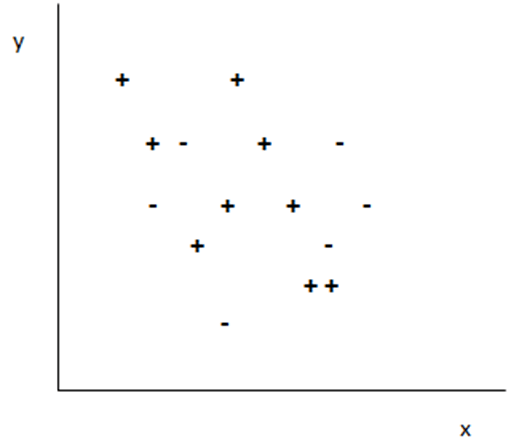
8. Which of the following is true about the given graph?
a) It uses pixel oriented technique to visualize four dimensions
b) It uses geometric projection technique to visualize three dimensions
c) It uses geometric projection technique to visualize four dimensions
d) It uses pixel oriented technique to visualize three dimensions
View Answer
Explanation: The graph represents a scatter plot. It is a type of geometric projection technique. The graph represents three dimensions. Two dimensions are plotted along the x and y axes. The third dimension is represented by the shape of the data points.
9. Which of the following is not a limitation of parallel coordinate technique?
a) Visual clutter
b) Overlap
c) Cannot visualize many data records
d) Cannot visualize high dimension data
View Answer
Explanation: The scatter plot represents two dimensions and the scatter plot matrix is used to represent more than two dimensions. But, when the number of dimension increases, the scatter plot matrix becomes difficult to understand. Parallel coordinate technique addresses this problem. But even it faces problems such as visual clutter, overlap and inability to represent a greater number of data records when the dimensionality increases.
Sanfoundry Global Education & Learning Series – Data Mining.
To practice all areas of Data Mining, here is complete set of Multiple Choice Questions and Answers.
If you find a mistake in question / option / answer, kindly take a screenshot and email to [email protected]
