This set of Data Mining Multiple Choice Questions & Answers (MCQs) focuses on “Basic Statistical Descriptions of Data – Set 2”.
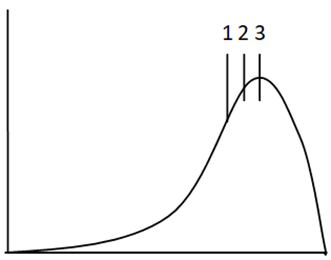
1. Which of the following is the most appropriate sequence for the given negatively skewed data diagram?
a) Mean, mode, median
b) Mode, median, mean
c) Mean, median, mode
d) Mode, mean, median
View Answer
Explanation: The negatively skewed data distribution has its mode occurring at a greater value than the median of the data. In the diagram, the mode occurs at 3 which is the peak of the curve. The mean and median can occur either at 1 or at 2.
2. Which of the following empirical relation is valid for moderately skewed data?
a) mean – mode ≈ 2 X (mean – median)
b) mean – mode ≈ 3 X (mean – median)
c) mean – mode ≈ 4 X (mean – median)
d) mean – mode ≈ mean – median
View Answer
Explanation: For a skewed unimodal data distribution, the relation, mean – mode ≈ 3 X (mean – median), is empirically valid. When any two measures from mean, median and mode are known, the third measure can be estimated.
3. Which of the following is true about the range of a set of values of a data set?
a) It is the product of the largest and the smallest value
b) It is the average of the largest and the smallest value
c) It is the sum of the largest and the smallest value
d) It is the difference between the largest and the smallest value
View Answer
Explanation: For a data set with given numeric data values, the range is calculated as the difference between the largest and smallest values of the data set. It is used as a measure of data dispersion.
4. The data points that partition a data distribution into consecutive groups of equal size are _____
a) Quantiles
b) Whiskers
c) Intervals
d) Range
View Answer
Explanation: In a data distribution, certain points can be taken which lie at regular intervals of the distribution. These points are taken such that they divide the data distribution into consecutive sets of equal size. These points are known as quantiles.
5. Which of the following is true about nth q-quantile where 0 < n < q?
a) It is the value lesser than n/q of the data values
b) It is the value greater than n/q of the data values
c) It is the value greater than (q-n)/q of the data values
d) It is not applicable in case of numeric data
View Answer
Explanation: For a given data distribution, the nth q-quantile is a point with a value greater than at most n/q values and less than at most (q-n)/q values. The n taken here is an integer and lies between zero and q but not equal to zero or q.
6. The median is also known as _____
a) 2-quantile
b) 3-quantile
c) 4-quantile
d) 5-quantile
View Answer
Explanation: For a given data distribution, the data point that divides the data distribution into two halves is the 2-quantile. This data point is also known as the median of the data distribution because the median is the middlemost value that separates the data into lower and upper halves.
7. The 4-quantiles are also known as _____
a) Percentiles
b) Quartiles
c) Quintiles
d) Octiles
View Answer
Explanation: The data points that divide a given data distribution into four consecutive parts of equal size, with each part representing one-fourth of the data, are known as 4-quantiles. The 4-quantiles are commonly referred to as quartiles.
8. Which of the following is true about interquartile range?
a) It is the distance between first and third quartiles
b) It is the distance between first and fourth quartiles
c) It does not measure the spread of the data
d) It is very sensitive to outliers
View Answer
Explanation: Quartiles are the data points that divide a data distribution into four equal parts. The distance between the first and third quartiles is known as interquartile range (IQR). It is a measure of spread of the data distribution.
9. Which of the following is true about interquartile range of data values 5, 2, 7, 4, 9, 8, 1, 14?
a) The interquartile range is 5
b) The interquartile range is 4
c) The interquartile range is 6
d) The interquartile range is 3
View Answer
Explanation: The interquartile range is given by: IQR = Q3 – Q1
The given data is: 5, 2, 7, 4, 9, 8, 1, 14
The data after sorting is: 1, 2, 4, 5, 7, 8, 9, 14
Total number of data values = 8
No of data values in each of the four sets = 8 / 4
= 2
So, the second data value is the first quartile and the sixth data value is the third quartile.
Q1 in above data = 2
Q3 in above data = 8
IQR = 8 – 2
= 6
So, interquartile range (IQR) value for the given data values is 6.
10. Which of the following is a commonly used threshold measured above the third quartile for identifying outliers?
a) IQR
b) 1.5 X IQR
c) 0.5 X IQR
d) 0.8 X IQR
View Answer
Explanation: The interquartile range, which is used as a measure of spread of the data distribution, is also used as a threshold measure for the identification of outliers. The values falling beyond 1.5 X IQR above the third quartile or below the first quartile are examined carefully to identify outliers.
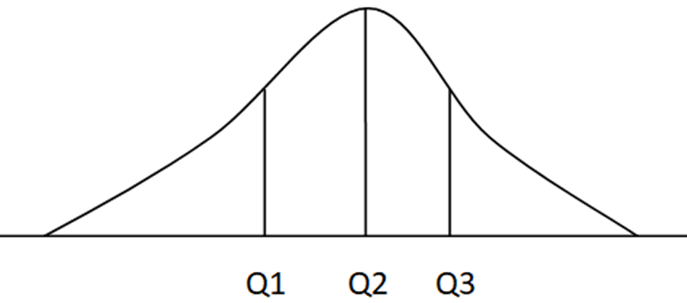
11. In the quartiles plotted below, Q1 is also known as _____
a) 10th percentile
b) 15th percentile
c) 25th percentile
d) 50th percentile
View Answer
Explanation: The diagram depicts the data distribution divided into quartiles, with each part equal in size and describing one-fourth of the data distribution. The first quartile, Q1, is also known as the 25th percentile.
12. Which of the following are the components of five-number summary in the case of skewed data?
a) Minimum, Q1, Median, Q3, Maximum
b) Minimum, Q1, Mode, Q3, Maximum
c) Minimum, Q1, Mode, Q3, Maximum
d) Minimum, Q1, Mode, Q2, Maximum
View Answer
Explanation: A better description of the shape of skewed data distribution is given by the five-number summary. It consists of the smallest data value, Q1, median, Q3, and the largest data value.
13. A box plot displays the data distribution based on five-number summary.
a) True
b) False
View Answer
Explanation: Box plot is used as a way of visualization of data distribution. It is based on the five-number summary which gives a more appropriate description of the shape of skewed data distribution.
14. The lines outside the box, extending to the highest and lowest values in a box plot are called as _____
a) Medians
b) Quartiles
c) Quintiles
d) Whiskers
View Answer
Explanation: The box plot is a visual description which consists of a box from the first quartile to the third quartile, spanning the length equal to the interquartile range (IQR). The lines extending outside the box, to the smallest and largest values, are called whiskers.
15. The box plot can be computed in time complexity _____
a) O (nlogn)
b) O (n2)
c) O (n3)
d) O (n)
View Answer
Explanation: The box plot, which visually describes a more appropriate summary of the data distribution, can be computed in O (nlogn) time. They can be approximately computed in lesser time but the quality may be less.
Sanfoundry Global Education & Learning Series – Data Mining.
To practice all areas of Data Mining, here is complete set of Multiple Choice Questions and Answers.
If you find a mistake in question / option / answer, kindly take a screenshot and email to [email protected]
