This set of Data Mining Multiple Choice Questions & Answers (MCQs) focuses on “Data Visualization – Set 2”.
1. Which of the following is true about Chernoff faces?
a) Maximum 15 dimensions can be displayed
b) Maximum 18 dimensions can be displayed
c) Maximum 19 dimensions can be displayed
d) Maximum 17 dimensions can be displayed
View Answer
Explanation: Chernoff faces is a type of icon based visualization technique which is used to represent multidimensional data. It represents the data as cartoon human faces. This technique can display up to 18 variables.
2. In icon based visualization, which of the following characteristic of face components is not used in representing the dimensions?
a) Color
b) Size
c) Shape
d) Orientation
View Answer
Explanation: Chernoff faces represent multidimensional data as cartoon human faces. Size, shape, orientation of the face components help in representing the data. The variations in these characteristics are used to represent the different dimensions.
3. In Chernoff faces, eye size is found to be not important in representation of data.
a) True
b) False
View Answer
Explanation: Chernoff faces, which represent data using cartoon human faces, have certain limitations. Not all facial components have equal importance and the order in which they are used matters. Eye size is found to have more importance to represent the multidimensional data.
4. Which of the following is not true about asymmetrical Chernoff faces?
a) It extends original technique
b) A face has symmetry along the y-axis
c) Maximum 38 dimensions can be displayed
d) Number of facial characteristics is doubled
View Answer
Explanation: Asymmetrical Chernoff faces is the extension to the original Chernoff faces technique. It takes into consideration the fact that a face has vertical symmetry. It doubles the number of facial characteristics and allows the representation of up to 36 dimensions.
5. In stick figure visualization, which of the following is true about the number of components in one figure?
a) Each stick figure has 7 components
b) Each stick figure has 8 components
c) Each stick figure has 6 components
d) Each stick figure has 5 components
View Answer
Explanation: Stick figure is a type of icon based visualization technique. It represents the multidimensional data. Each stick figure is composed of five components which are four limbs and a body.
6. In hierarchical visualization technique, dimensions are partitioned into subspaces.
a) True
b) False
View Answer
Explanation: When there are a large number of dimensions, the simultaneous visualization of these dimensions become complex. The hierarchical visualization technique partitions the dimensions into subspaces which are analyzed in a hierarchical manner.
7. In hierarchical visualization technique, tree-maps display hierarchical data using nested _____
a) Rectangles
b) Circles
c) Triangles
d) Lines
View Answer
Explanation: The hierarchical visualization technique analyzes the data with a large number of dimensions in a hierarchical manner. The tree-map, which is a hierarchical visualization technique, displays the hierarchical data using nested rectangles.
8. Worlds-within-Worlds is a _____
a) Hierarchical visualization technique
b) Icon based visualization technique
c) Pixel based visualization technique
d) Geometric projection technique
View Answer
Explanation: The hierarchical visualization technique is used for the analysis of data with a large number of dimensions in a hierarchical manner. Worlds-within-Worlds is a hierarchical visualization technique which is capable of using many levels of ‘world’ to represent the data.
9. Which of the following is not true about tag clouds?
a) It visualizes user-generated tags
b) Tags are listed in some order
c) Font-size is a measure of the importance of a tag
d) Font-size has no effect on the importance of a tag
View Answer
Explanation: With the growing use of technology, more data is being generated. Tags are associated with various web objects by the users to represent the information about the object. These tags are visualized using tag clouds. These tags are listed in some order in the tag cloud. The font size of a tag indicates its importance.
10. Which of the following technique is represented in the given diagram?
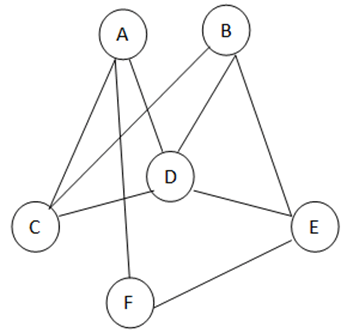
a) Tree-map
b) Chernoff face
c) Stick-figure
d) Tag cloud
View Answer
Explanation: The given diagram represents a tag cloud which is used to analyze the user-generated tags. The circles represent the various tags and the links between the tags represent the strong correlation between those tags.
Sanfoundry Global Education & Learning Series – Data Mining.
To practice all areas of Data Mining, here is complete set of Multiple Choice Questions and Answers.
If you find a mistake in question / option / answer, kindly take a screenshot and email to [email protected]
