This set of Data Mining Multiple Choice Questions & Answers (MCQs) focuses on “Data Reduction – Set 2”.
1. Which of the following is not true about attribute subset selection?
a) Minimum set of attributes is selected
b) The probability distribution of the created set is close to the original distribution using all the attributes
c) The probability distribution of the created set is completely different from the original distribution using all the attributes
d) It makes the study of patterns easier
View Answer
Explanation: Attribute subset selection removes redundant attributes to reduce the size of the data which makes the study of patterns easier. A minimum set of attributes is selected such that the probability distribution of the set is close to the probability distribution of the original set of attributes.
2. For n attributes, the number of subsets possible is _____
a) 2n
b) 2n
c) 2/n
d) n/2
View Answer
Explanation: Given n attributes, we can have 2n possible subsets from these attributes. When n is large, the number of subsets is a large quantity and hence, searching each of the subset to find patterns may be very time consuming.
3. For an attribute set having n attributes, the number of attributes in initial reduced set in case of forward selection method in attribute subset selection is _____
a) 0
b) 1
c) n
d) n/2
View Answer
Explanation: Given an attribute set of n attributes, in case of forward selection in attribute subset selection, the initial reduced set is an empty set. The best attributes are chosen iteratively and added to the reduced set.
4. The number of attributes in initial reduced set in case of backward elimination method in attribute subset selection for an attribute set having n attributes is _____
a) 0
b) 2
c) n
d) n/2
View Answer
Explanation: Given an attribute set of n attributes, in case of backward elimination method in attribute subset selection, the initial reduced set is the original set with all the attributes. The worst attributes are iteratively removed from the set.
5. Log linear models are used for _____
a) Lossless data multiplication
b) Lossy data redundancy
c) Parametric data reduction
d) Non-parametric data reduction
View Answer
Explanation: Log linear models are used for parametric data reduction. It can also be used for data smoothing. It can handle sparse data and can also work with skewed data.
6. Given the regression equation y = wx + b, which of the following statements is false?
a) y is called predictor variable
b) x can be a numeric attribute
c) w and b are regression coefficients
d) Variance of y is assumed to be constant
View Answer
Explanation: In the regression equation y = wx + b, y is the response variable and x is the predictor variable, w and b are the regression coefficients. Here, w specifies the slope of the line and b specifies the y intercept.
7. In equal depth histogram, which of the following is kept constant?
a) Frequency of the bucket
b) Width of the bucket
c) Mean of the bucket
d) Standard deviation of the bucket
View Answer
Explanation: In equal depth histogram, the frequency of the bucket is kept constant. The buckets are created such that each bucket has approximately equal number of data samples. It is also known as equal frequency histogram.
8. Multidimensional histograms can be used to represent the dependency between attributes.
a) True
b) False
View Answer
Explanation: The histograms are an effective tool for the study of data. It can also work with sparse data and skewed data. It can also be used with multiple attributes. Multidimensional histograms can be used to study the dependency between attributes.
9. The maximum distance between any two objects in a cluster is known as _____
a) Diameter of the cluster
b) Radius of the cluster
c) Circumference of the cluster
d) Area of the cluster
View Answer
Explanation: Clustering technique creates clusters of data samples such that data samples within the cluster are similar to each other and dissimilar to data samples in the other clusters. The maximum distance between any two objects in a cluster is known as the diameter of the cluster.
10. The average distance of each cluster point from the cluster Centroid is called _____
a) Radius of the cluster
b) Centroid distance
c) Median distance
d) Mean square distance
View Answer
Explanation: Clustering involves creation of clusters with similar data points grouped together in one cluster. The average distance of each data point in a cluster from the cluster Centroid is called Centroid distance. It is a measure of the quality of the cluster.
11. Given a dataset D, with T tuples, if S tuples are drawn from the dataset (S < T), where each tuple is equally likely to be sampled and the drawn tuples are not replaced. The technique is _____
a) Simple random sampling without replacement
b) Simple random sampling with replacement
c) Stratified sample
d) Cluster sample
View Answer
Explanation: Sampling helps in data reduction in which we draw random sample of the data. In simple random sampling without replacement, for a dataset D consisting of T tuples, S tuples, where S < T, are drawn from the dataset. Each tuple is equally likely to be sampled and the tuples are drawn without replacement.
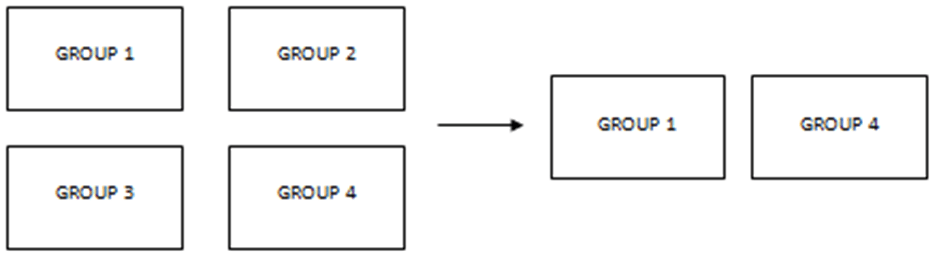
12. Which of the following is the most appropriate sampling technique represented by the following diagram?
a) Simple random sampling without replacement
b) Cluster sample
c) Simple random sampling with replacement
d) Stratified sample
View Answer
Explanation: The tuples in a database can be grouped into clusters where similar tuples are grouped into the same cluster. The similarity criterion is chosen based on the task on hand. The above diagram represents cluster sample where some random sample of clusters is drawn from the clustered dataset.
13. Given a sample A of size s drawn from a dataset of T tuple (s < T), which of the following is true?
a) Cost of drawing the sample A is proportional to s
b) Cost of drawing the sample A is proportional to T
c) Cost of drawing the sample A is proportional to T2
d) Cost of drawing the sample A is proportional to (s/T)2/3
View Answer
Explanation: Sampling technique helps in data reduction. Some random sample of tuples is drawn to represent the entire dataset. The cost of drawing a sample from a dataset is proportional to the size of the sample.
Sanfoundry Global Education & Learning Series – Data Mining.
To practice all areas of Data Mining, here is complete set of Multiple Choice Questions and Answers.
If you find a mistake in question / option / answer, kindly take a screenshot and email to [email protected]
