This set of Data Mining Multiple Choice Questions & Answers (MCQs) focuses on “Basic Statistical Descriptions of Data – Set 3”.
1. Which of the following is a correct interpretation of a low standard deviation value for a data distribution?
a) Data is spread over a large range of values
b) Data points are close to the mean
c) Data points are close to the mode
d) Data points are close to the 25th percentile
View Answer
Explanation: Standard deviation, along with variance, is a measure of data dispersion. It measures the spread around the mean by taking mean as the center of the data. The data distribution has a low standard deviation when its data values lie close to the mean.
2. Which of the following is true about the data values 4, 7, 3, 9, 11, 17?
a) The variance and standard deviation are 20.13 and 10.32 respectively
b) The variance and standard deviation are 21.91 and 4.68 respectively
c) The variance and standard deviation are 17.54 and 2.74 respectively
d) The variance and standard deviation are 25.76 and 4.99 respectively
View Answer
Explanation: The variance is given by :
\( V = (\frac{1}{n})*∑_{i=1}^n(x_i^2 )-m^2\) where m is the mean and n is the no. of values
The mean of 4, 7, 3, 9, 11, 17 is
M = (4 + 7 + 3 + 9 + 11 + 17)/6
= 8.5
V = (1/6)*(42 + 72 + 32 +92 + 112 + 172) – 8.52
V = (1/6)*(16 + 49 + 9 + 81 + 121 + 289) – 72.25
= 21.91
Standard deviation, σ = \(\sqrt{V}\)
= \(\sqrt{21.91}\)
= 4.68
3. Standard deviation (σ) is negative (σ<0) when all the data values are equal.
a) True
b) False
View Answer
Explanation: For a data distribution, its spread is determined by the value of standard deviation. In the case when all the data values are same, the standard deviation value is zero. When all the values are not same, the standard deviation is a positive non-zero value.
4. A quantile plot is used for the description of _____
a) Bivariate data distribution
b) Univariate data distribution
c) Multivariate data distribution
d) Joint probability distribution
View Answer
Explanation: Quantiles are the data points which give information about dispersion of a data distribution. A quantile plot describes a data distribution by graphic displays. It plots information about the quantiles in univariate data distribution.
5. Which of the following is not the preferred attribute type for quantile plots?
a) Nominal
b) Ordinal
c) Interval-scaled
d) Ratio-scaled
View Answer
Explanation: For a given data distribution, the quantile plots graphically describe the information about spread of the data values. The quantile plots are plotted for ordinal or numeric type of attributes.
6. The quantile-quantile plot, which is used for visual description of data, graphs the quantiles of a univariate distribution against the quantiles of a _____
a) Univariate distribution with numeric attributes
b) Multivariate distribution with numeric attributes
c) Multivariate distribution with ordinal attributes
d) Univariate distribution with binary attributes
View Answer
Explanation: The quantile plot, which visually describes the data, is based on univariate distribution. The quantile-quantile plot is a graphical plot between the quantiles of a univariate distribution against the corresponding quantiles of the other univariate distribution.
7. The histogram is also referred to as bar chart for attributes of type _____
a) Nominal
b) Interval-scaled
c) Ratio-scaled
d) Continuous
View Answer
Explanation: The histograms are the visual plots which represent the frequency of the attributes. When the attribute under consideration is of nominal type, the histogram plot is referred to as a bar chart.
8. Which of the following is not true about scatter plots?
a) It is used to identify relationship between attributes
b) It is used in the case of univariate distribution
c) It is used to identify outliers
d) It is used to identify clusters
View Answer
Explanation: Scatter plots are the plots that are used in bivariate distribution. They are used to identify the relationships between the data values. They are also used to identify clusters and outliers in a data set.
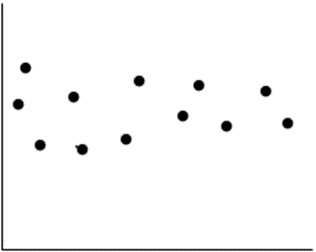
9. Which of the following is correlation is represented by the given scatter plot?
a) Positive correlation
b) Negative correlation
c) Null correlation
d) Perfect correlation
View Answer
Explanation: The scatter plot is the visual plot used in bivariate distributions. It is used to identify correlation between the data values. In the given diagram, there is no correlation between the attributes on x and y axis as there is no pattern in the scatter plot.
10. Scatter plot extending to k attributes is called as _____
a) Scattergram
b) Scatter chart
c) Scatter matrix
d) Scatter diagram
View Answer
Explanation: The scatter plot, which is used to visually describe bivariate data distribution, is plotted between two variables. The attributes can be increased and a scatter plot is plotted between each pair of attributes. It forms a scatter matrix.
Sanfoundry Global Education & Learning Series – Data Mining.
To practice all areas of Data Mining, here is complete set of Multiple Choice Questions and Answers.
If you find a mistake in question / option / answer, kindly take a screenshot and email to [email protected]
