This set of Data Mining Multiple Choice Questions & Answers (MCQs) focuses on “Basic Statistical Descriptions of Data”.
1. Which of the following is not true about the statistical description of data?
a) It is used to identify the data properties
b) It is used to identify noise
c) It is not used to identify noise
d) It gives a general view of the data
View Answer
Explanation: Statistical description of data is used to explore the properties of data. It is also used to identify noise in the data. The statistical data description is useful to get the big picture or the general view of the data.
2. Which of the following is the most effective measure of the center of symmetric data set?
a) Mean
b) Median
c) Mode
d) Midrange
View Answer
Explanation: In symmetric data distribution, the variable values occur at regular frequencies. The arithmetic mean is the most commonly used measure of central tendency for symmetric data and represents the center of the data set.
3. Suppose there are five students in a class. A test was held and the students got 50, 45, 83, 60 and 92 marks in the test. Class performance, which is the average marks, has to be submitted to the authorities for grading. Performance, above 90, is graded as excellent, between 60 and 90, is graded as good, between 40 and 60, is graded as average and below 40 is graded as poor. Classes graded good and excellent are awarded. Will the class be awarded?
a) Yes, because the class performance is excellent
b) Yes, because the class performance is good
c) No, because the class performance is average
d) No, because the class performance is poor
View Answer
Explanation: Given,
Marks Data: 50, 45, 83, 60, 92
Mean of a data set with values x1, x2… xn is given by:
Mean =\(\frac{x1+x2+.……..+xn}{n}\)
Thus, mean of above values = (50 + 45 + 83 + 60 + 92) / 5
= 330 / 5
= 66
Hence, the above mean leads to the class performance graded as good and the class is awarded.
4. In a survey related to a movie, 5 people gave a rating of 3, 6 gave a rating of 2 and 7 gave a rating of 4. Which of the following is true about the average rating received by the movie?
a) The movie received an average rating of 4.5
b) The movie received an average rating of 1.2
c) The movie received an average rating of 3.05
d) The movie received an average rating of 5.7
View Answer
Explanation: Since the data values and their weights are given, we find the weighted mean.
The weighted mean of a data set with values x1, x2… xn and weights w1, w2… wn is:
Weighted Mean = \(\frac{w1*x1+w2*x2+.……..+wn*xn}{w1+w2+.……..+wn}\)
Thus, weighted mean of above values = (5*3 + 6*2 + 7*4) / (5 + 6 + 7)
= (15 + 12 + 28) / 18
= 3.05
Hence, the movie received an average rating of 3.05.
5. Which of the following is true about the arithmetic mean?
a) It is sensitive to outliers
b) It is not sensitive to outliers
c) Extreme values do not affect the mean
d) Mean of the data cannot be corrupted
View Answer
Explanation: The arithmetic mean of a data set is the sum of the data values divided by the total number of data values in the data set. The arithmetic mean can be corrupted by outliers or noise in the data.
6. Which of the following is true about trimmed mean?
a) It is used in case of a small number of extreme values
b) It is used in case of a large number of extreme values
c) Sorting of data is not preferred
d) Trimming points are not arbitrary
View Answer
Explanation: Due to the sensitivity of arithmetic mean to noise, trimmed mean is computed. It is computed by sorting the data values and ignoring the n highest and lowest values in the calculations. The choice of n is arbitrary and depends on the data and task. The number of extreme values chopped should be small to avoid the loss of too much information.
7. The measure of central tendency that separates the data set into higher and lower halves is _____
a) Mean
b) Median
c) Mode
d) Midrange
View Answer
Explanation: The Median is a measure of central tendency that separates the data into higher and lower halves. The median is computed by sorting the data values in the data set and then choosing the middlemost value.
8. Which of the following is true about median for a given data set of N values where N is even?
a) The median does not exist
b) The median is unique
c) The median is not unique
d) Left-most value of the data set is taken as the median
View Answer
Explanation: The median is the middlemost value of a data set when sorted in some order. When the number of data values is odd, the median is unique. In the case of an even number of data values, we find the two middlemost values and any value between those two values form the median.
9. Which of the following is not true about median?
a) It cannot be used when the data is skewed
b) It can be used when the data is skewed
c) It can be used when the boundary-values are not known
d) It can be used when the data has outliers
View Answer
Explanation: When the data is skewed, the mean is not considered to be an effective measure of central tendency. The median is considered a better measure than mean in such cases as it is not corrupted by the extreme values.
10. An organization has eight employees with salaries are Rs 5000, Rs 6500, Rs 2100, Rs 3700, Rs 1200, Rs 100000, Rs 4200, Rs 50? Which of the following is true about the most expected salary of any chosen employee of the organization?
a) The most expected salary is Rs 3120
b) The most expected salary is Rs 70560
c) The most expected salary is Rs 3950
d) The most expected salary is Rs 5890
View Answer
Explanation: The values given when arranged in ascending order are:
Rs 50, Rs 1200, Rs 2100, Rs 3700, Rs 4200, Rs 5000, Rs 6500, Rs 100000
We see from the above-sorted data that the highest value which is Rs 100000 is an extreme value as it pushes the mean towards higher value which may not represent the correct picture of the expected salary. So we find the median of the above data.
Since, N, which is the number of data values, is even, we find the two middlemost values.
They are Rs 3700 and Rs 4200. The median can be any value between these two values. So, we can represent the average of these two values as the median.
Average = (Rs 3700 + Rs 4200) / 2
= Rs 7900 / 2
= Rs 3950
Hence, the most expected salary of any chosen employee of the organization is Rs 3950.
11. Which of the following is not true about mode?
a) It is the most frequently occurring value
b) It is defined for both qualitative and quantitative values
c) A data set can have at most one mode
d) A data set can have more than one mode
View Answer
Explanation: Mode is the measure of central tendency that is defined for both quantitative and qualitative data. It gives the most frequently occurring value in a data set. In the case of more than one value occurring with the greatest frequency, more than one mode exists.
12. For symmetric distribution, the mean and median are same.
a) True
b) False
View Answer
Explanation: The variable values occurring at regular frequencies form symmetric data distribution. In the case of symmetric distribution like uniform distribution, mean and median are same.
13. Which of the following is true about midrange?
a) It is the average of the greatest and the smallest value in the data set
b) It is the product of the greatest and the smallest value in the data set
c) It is the difference between the greatest and the smallest value in the data set
d) It is the sum of the greatest and the smallest value in the data set
View Answer
Explanation: For a numeric data set, in addition to, mean, median, mode, another measure midrange can also be computed. The midrange of a data set is the average of the highest and the lowest values of that data set.
14. Which of the following is the correct sequence for the given data diagram?
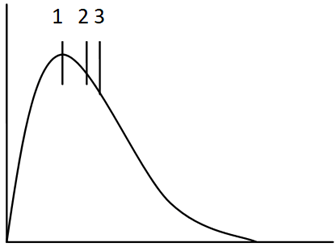
a) Median, mode, mean
b) Mode, median, mean
c) Mean, median, mode
d) Median, mean, mode
View Answer
Explanation: The diagram depicts a positively skewed data distribution. In such a data distribution, the mode occurs at a smaller value than the median. Hence 1 is the mode due to it being at the peak of the curve. The median occurs after 1, which may either be at 2 or 3.
15. Which of the following is true for a unimodal symmetric data distribution?
a) The mean, median, mode lie at the same center value
b) The mean occurs at a value smaller than the median
c) The mean occurs at a value larger than the median
d) The mean occurs at a value larger than the mode
View Answer
Explanation: The symmetric data distribution, such as the uniform distribution, has its values occurring at equal frequencies and its histogram can be divided into two identical parts. When such a distribution is unimodal, the mean, median and mode of its data values lie at the same center.
Sanfoundry Global Education & Learning Series – Data Mining.
To practice all areas of Data Mining, here is complete set of Multiple Choice Questions and Answers.
If you find a mistake in question / option / answer, kindly take a screenshot and email to [email protected]
