This set of Mechanical Metallurgy Multiple Choice Questions & Answers (MCQs) focuses on “Effect of Mean Stress on Fatigue”.
1. If the mean stress is zero for any component, then the value of the stress ratio (R) will be equal to _______
a) 1
b) 0.5
c) -1
d) -0.5
View Answer
Explanation: The stress ratio is defined as
-> σmin/σmax
-> So in the case where mean stress is equal to zero, the σmin= – σmax
So the stress ratio will be equal to -1.
2. When the value of R becomes positive, that indicates the mean stress is becoming _________
a) more negative
b) more positive
c) remain constant
d) no relationship
View Answer
Explanation: The value of stress ratio becomes positive is equivalent to saying that the mean stress is increasing; hence, it becomes more positive.
3. When the R (stress ratio) becomes more positive, the fatigue limit _____________
a) increases
b) decreases
c) remains constant
d) no relationship
View Answer
Explanation: As the stress ratio is increasing, it means stress is becoming more positive and load reversing is less severe. (It is not complete tensile/compressive cycle but shifted towards one end). Hence, the fatigue limit increases.
4. In the below S-N diagram, the R1, R2, R3, R4 indicates the stress ratio for the given curve. The correct order of the values of stress ratio will be ___________
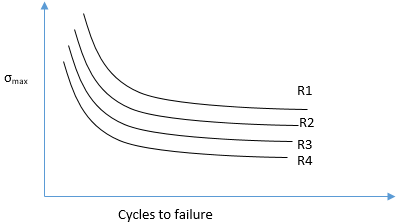
a) R1>R2>R3>R4
b) R4>R3>R2>R1
c) R3>R4>R1>R2
d) R2>R3>R1>R4
View Answer
Explanation: We have seen that as the mean stress increases, the fatigue life of the component increases. And simultaneously the stress ratio decreases. So, the R4 has minimum life, stress ratio will be least and R1 will have the highest life.
5. In the below S-N diagram, the M1, M2, M3, M4 indicates the mean stress for the given curve. The correct order of the values of mean stress will be ___________
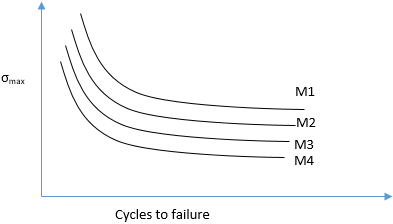
a) M1>M2>M3>M4
b) M4>M3>M2>M1
c) M3>M4>M1>M2
d) M2>M3>M1>M4
View Answer
Explanation: As the mean stress increases, the fatigue life of the component increases. So highest mean stress means the highest fatigue life of the component.
6. As the mean stress increases, the allowable alternating stress on the component also increases.
a) True
b) False
View Answer
Explanation: As the mean stress increases, the tensile or compressive force on the component increases. So, the range of stress which the sample can hold also reduces.
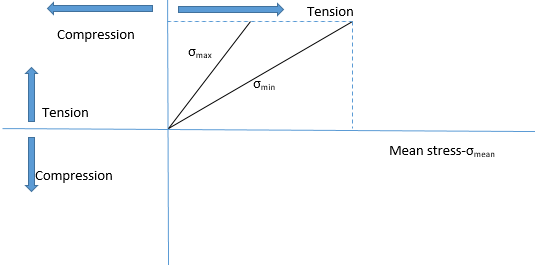
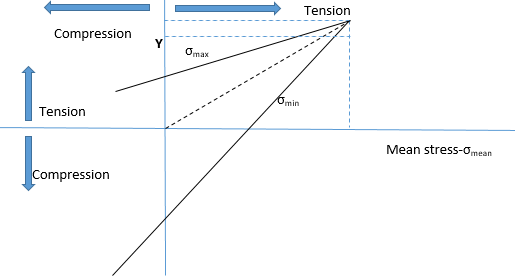
7. The following diagram is the correct representation of the Goodman diagram.
a) True
b) False
View Answer
Explanation: The Goodman diagram shows the allowable range of stress that can be applied to the component which does not cause the failure to it. So as the mean stress increases, the allowable range decreases, but in this diagram it is shown other way around.
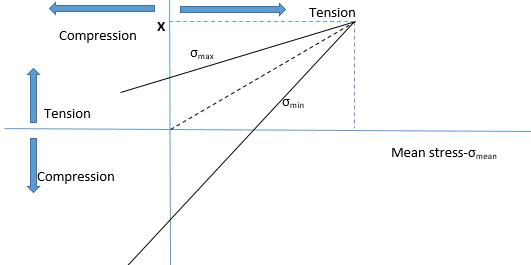
8. The following picture is the correct representation of the Goodman diagram. The point X in the given curve indicates the ______________
a) yield point
b) ultimate tensile strength point
c) failure point
d) minimum stress point
View Answer
Explanation: The point X corresponds to the point where the allowable range of stress is zero. So this point is equivalent to tensile strength point because, above this point, the material fails if fluctuating stress is applied.
9. The following diagram is the correct representation of the Goodman diagram. The point Y in the given curve indicates the ______________
a) yield point
b) ultimate tensile strength point
c) failure point
d) minimum stress point
View Answer
Explanation: The point Y corresponded to a point where there is an allowable range of stress which can be applied to the material. After this point, generally the fatigue testing is stopped.
10. The compressive residual stress ____________ the fatigue limit.
a) increases
b) decreases
c) does not change
d) no relation
View Answer
Explanation: The compressive residual stress on the components increases the fatigue limit of the component. That is why shot peening help in increasing fatigue life.
Sanfoundry Global Education & Learning Series – Mechanical Metallurgy.
To practice all areas of Mechanical Metallurgy, here is complete set of 1000+ Multiple Choice Questions and Answers.
If you find a mistake in question / option / answer, kindly take a screenshot and email to [email protected]
- Practice Metallurgical Engineering MCQs
- Check Metallurgical Engineering Books
- Apply for Metallurgical Engineering Internship
- Check Mechanical Metallurgy Books
