This is a Java Program to Display a Pie Chart Using a Frame
We have to write a program in Java such that it displays a pie chart for a given data
For displaying a pie chart, we can have the following set of input and output.
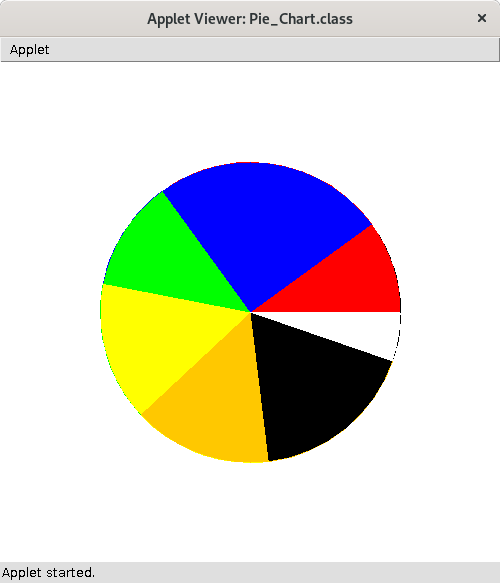
To View the Pie Chart :
When the program is executed,
it is expected that the frame contains a pie chart.
1. Create an array of data type int to store the value of each data.
2. Create an array of data type Color to store the desired color in the pie chart for the respective data value.
3. Get the sum of all data values.
4. For each data value, calculate the percentage share in the pie chart.
5. Draw an arc for each data value.
6. Fill the arc with the respective color.
Here is source code of the Java Program to create a pie chart. The program is successfully compiled and tested using javac compiler on Fedora 30. The program output is also shown below.
/* Java Program to Create a Pie Chart using a Frame */import java.applet.*;
import java.awt.*;
public class Pie_Chart extends Applet
{int[] data_values;
Color[] data_clr;
int total;
//Function to create a data setpublic void init()
{setBackground(Color.white);
//Create a data set to represent in pie-chartdata_values=new int[]{10,25,12,15,15,18,5};
data_clr=new Color[]{Color.red,Color.blue,Color.green,Color.yellow,
Color.orange,Color.black,Color.white};
}//Function to get the sum of all data valuespublic void start()
{int n = data_values.length;
int i;
total=0;
for(i=0;i<n;i++)
{total+=data_values[i];
}}//Function to draw the pie chartpublic void paint(Graphics g)
{int i;
int start_angle = 0;
for(i=0;i<data_values.length;i++)
{int arc_angle = (int)(data_values[i]*360 / total);
g.drawArc(100,100,300,300,start_angle,arc_angle);
g.setColor(data_clr[i]);
g.fillArc(100,100,300,300,start_angle,arc_angle);
start_angle+=arc_angle;
}}}/*<applet code = Pie_Chart.class width=500 height=500></applet>*/
To compile an execute the program use the following commands :
>>>javac My_Cursor.java
>>>appletviewer My_Cursor.java
1. Create arrays to store the data values and color for the respective data.
2. Get the sum of all data values.
3. Get the share of each data in the pie chart usin and draw an arc from the last position of arc to the calculated position.
4. Change the color of arc using setColor method.
5. Fill the arc using fillArc method.
Here’s the run time test cases for creating a pie chart.
Test case – To View the Pie Chart:
Sanfoundry Global Education & Learning Series – Java Programs.
- Apply for Computer Science Internship
- Practice Programming MCQs
- Practice Information Technology MCQs
- Apply for Java Internship
- Practice BCA MCQs
