This set of Heat Transfer Operations Multiple Choice Questions & Answers (MCQs) focuses on “Evaporators – Enthalpy Concentration Diagram”.
1. The straight line in the enthalpy concentration diagram is known as ___________
a) Dew line
b) Azeotropic line
c) Auxiliary line
d) Boiling line
View Answer
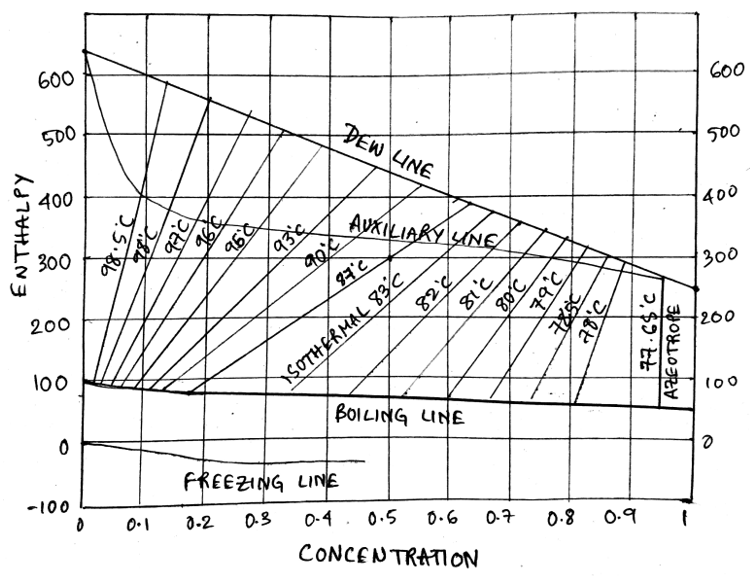
Explanation: The dew line in the EC diagram is the straight line with a negative slope running down the plot.
2. What is the name of the line that joins the Dew line to the Boiling line in an enthalpy concentration diagram?
a) Azeotropic line
b) Isothermal line
c) Auxiliary line
d) Freezing line
View Answer
Explanation: The given line in red defines the isothermal line which loves left with increasing temperature.
3. With increasing the temperature of the isothermal line, the isothermal lines shift towards___________ in an enthalpy concentration diagram.
a) Greater Concentration
b) Lesser Concentration
c) Upwards
d) Downwards
View Answer
Explanation: The right extreme axis is for 100% concentration of solute and left axis is for pure water. Hence as the isothermal line temperature increases, it moves towards the left, that is towards the lesser concentration.
4. The _________ represents the line of 100% secondary liquid concentration in an enthalpy concentration diagram.
a) Top horizontal axis
b) Left vertical axis
c) Right vertical axis
d) Bottom horizontal axis
View Answer
Explanation: The enthalpy concentration diagram can be represented as given below, Observe that the concentration/mole fraction increases as we go to the right in the diagram.
5. The auxiliary line value ____________ as we move towards higher concentrations in an enthalpy concentration diagram.
a) Increases
b) Decreases
c) Remains same
d) Exponentially increases
View Answer
Explanation: The auxiliary line connects the boiling line and dew line by acting as a vertex of a right angle triangle with the hypotenuse as the isothermal line.
6. In an enthalpy concentration diagram, the point of intersection of a particular isothermal line to the Dew line is used to calculate _____________
a) Vapour phase composition
b) Liquid phase composition
c) Water mole fraction
d) Liquid phase weight fraction
View Answer
Explanation: If we move along the isothermal line to the Dew Line and pin the intersection point, now we move vertically down to the composition value which is the required mole fraction in the vapour phase.
7. What is the vapour phase composition if the isothermal temperature is 87℃ and the mixture composition is 30%?
a) 44% ethanol
b) 74% ethanol
c) 64% ethanol
d) 18% ethanol
View Answer
Explanation: In the given graph, we first select the point 0.3(30%) and move vertically upwards to intersect the isothermal line of 87℃. The we move along the isothermal line to the Dew Line and pin the intersection point, now move vertically down to the composition value which is the required answer = 0.64 = 64%.
8. What is the Liquid phase composition if the isothermal temperature is 87℃ and the mixture composition is 30%?
a) 64% ethanol
b) 74% ethanol
c) 54% ethanol
d) 18% ethanol
View Answer
Explanation: In the given graph, we first select the point 0.3(30%) and move vertically upwards to intersect the isothermal line of 87℃. The we move along the isothermal line to the Boiling Line and pin the intersection point, now move vertically down to the composition value which is the required answer = 0.18 = 18%.
9. What is the azeotropic concentration according to the given enthalpy concentration diagram?
a) 95% ethanol
b) 90% ethanol
c) 99% ethanol
d) 5% ethanol
View Answer
Explanation: The azeotropic concentration line given at the extreme right of the diagram corresponds to the temperature and composition of the azeotropic mixture of the solution. It is a vertical line and corresponds to 95%.
10. What is the enthalpy of mixture of water and ethanol if the mixture composition on 35% and the temperature of mixture is 87℃?
a) 300 Kcal/kg
b) 200 Kcal/kg
c) 250 Kcal/kg
d) 210 Kcal/kg
View Answer
Explanation: In the given graph, we first select the point 0.35(35%) and move vertically upwards to intersect the isothermal line of 87℃. Then we move horizontally left to the enthalpy value on the y-axis which is the required answer = 200 Kcal/kg.
11. What is the vapour phase enthalpy of mixture of water and ethanol if the mixture composition on 35% and the temperature of mixture is 87℃?
a) 352 Kcal/kg
b) 302 Kcal/kg
c) 392 Kcal/kg
d) 405 Kcal/kg
View Answer
Explanation: In the given graph, we first select the point 0.35(35%) and move vertically upwards to intersect the isothermal line of 87℃. The we move along the isothermal line to the Dew Line and pin the intersection point, now move horizontally left/right to the enthalpy axis value which is the required answer = 392 Kcal/kg.
12. What is the liquid phase enthalpy of mixture of water and ethanol if the mixture composition on 35% and the temperature of mixture is 87℃?
a) 70 Kcal/kg
b) 80 Kcal/kg
c) 100 Kcal/kg
d) 90 Kcal/kg
View Answer
Explanation: In the given graph, we first select the point 0.35(35%) and move vertically upwards to intersect the isothermal line of 87℃. The we move along the isothermal line to the Boiling Line and pin the intersection point, now move horizontally left/right to the enthalpy axis value which is the required answer = 90 Kcal/kg.
13. When we take a point between the Boiling line and the dew line in an enthalpy concentration diagram, then the mixture can exist in _______ in that particular point.
a) Liquid phase
b) Solid state
c) Gaseous state
d) Liquid and gas both
View Answer
Explanation: The region of space between the Boiling line and the Dew line in an enthalpy concentration diagram exists in two phases which is the liquid phase and the gas phase. The liquid is dominant in the boiling line and gas in the dew line.
14. When we take a point between the Boiling line and the freezing line in an enthalpy concentration diagram, then the mixture can exist in _______ in that particular point.
a) Liquid phase
b) Solid state
c) Gaseous state
d) Liquid and gas both
View Answer
Explanation: The region of space between the Boiling line and the freezing line in an enthalpy concentration diagram exists in single phase which is the liquid phase.
Sanfoundry Global Education & Learning Series – Heat Transfer Operations.
To practice all areas of Heat Transfer Operations, here is complete set of 1000+ Multiple Choice Questions and Answers.
If you find a mistake in question / option / answer, kindly take a screenshot and email to [email protected]
- Check Chemical Engineering Books
- Check Heat Transfer Operations Books
- Apply for Chemical Engineering Internship
- Practice Chemical Engineering MCQs
