This set of Enzyme Technology Multiple Choice Questions & Answers (MCQs) focuses on “Kinetics of Immobilized Enzymes – 1”.
1. The kinetic behavior of a bound enzyme is similar to that of free enzyme.
a) True
b) False
View Answer
Explanation: The above statement is false. The kinetic behavior of a bound enzyme differs significantly from that of the same enzyme because of the following reasons:
Property of the enzymes may get modified by the immobilization protocols.
Different protocols may different effects on enzyme due to conformational alteration in enzyme or due to nature of support.
2. What does the following diagram represent?

a) Adsorption
b) Entrapment
c) Microenvironment and Macroenvironment
d) Covalent binding
View Answer
Explanation: The diagram below represents a cross-section of an immobilized enzyme particle showing micro and macro-environment.
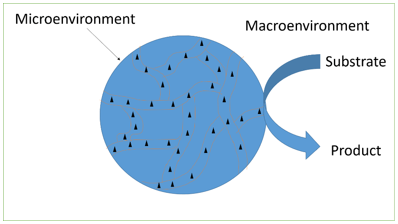
The triangle represents the enzyme molecules. The internal solution with part of the surrounding solution is referred to as microenvironment. This is influenced by the surface characteristics of the immobilized enzyme. Partitioning of substances will occur between these two environments. Substrate molecules (S) must diffuse through the surrounding layer (external transport) as well as the pores (internal transport) in order to utilize all of the enzyme available.
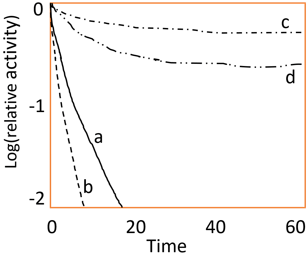
3. What does the following diagram represent?
a) Effect of substrate inhibition on the rate of enzyme catalyzed reaction
b) Effect of multipoint interaction for stabilization of enzyme
c) Miachelis Menten plot
d) Effect of temperature on activity of enzyme
View Answer
Explanation: The above diagram represents the multipoint interaction for stabilization of enzyme. Point ‘a’ represents the activity of the free enzymes whereas point ‘b’ represent the activity of the enzyme bound to some matrix. Point ‘c’ and ‘d’ represent the activity of the bound enzyme covalently and activity of the entrapped enzyme in a gel respectively. Miachelis Menten plot turns out to be a hyperbolic curve. Effect of temperature on activity of enzymes turns out to be a bell shaped curve.
4. For positively charged substrates, \(K_m^{app}\) is given by which of the following?
a) Kmλ
b) Km/λ
c) Vmax/2
d) Vmax
View Answer
Explanation: For immobilized enzymes, the Miachelis Menten equation changes to be \(V=\frac{V_max}{1+\frac{K_m^{app}}{[S_0]}}\)
\(K_m^{app}\) is apparent Km and given \(K_m^{app}\) = Kmλ for positively charged substrates. This can be calculated when the concentration of positively charged substrates in the bulk solution is known. For negatively charged substrates, the \(K_m^{app}\) = Km/λ. Km is the substrate concentration at which Vmax is reduced to half. Vmax is the maximum rate equation.
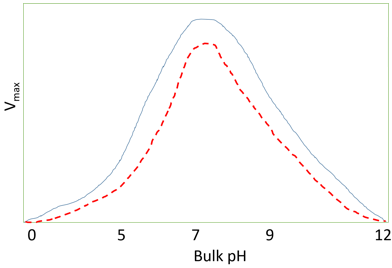
5. What does the following diagram represent?
a) Effect of temperature on activity of enzymes
b) pH activity profile of immobilized enzymes
c) Effect of hydrophobic support on pH activity profile of immobilized enzymes
d) Effect of multipoint interaction for stabilization of enzymes
View Answer
Explanation: The above diagram represents the effect of hydrophobic support on pH activity profile of immobilized enzymes. The dashed red line represents enzyme immobilized on a hydrophobic support. Hydrophobic interactions involve an ordered arrangement of water molecules at the approach of hydrophobic surfaces. These interactions reduce the dielectric constants, in-turn affecting the Km of immobilized enzyme. The effective decrease in dielectric constants for the micro-environment reduces the dissociations of charged groups increasing pKa of some other groups. Lastly, even the particular immobilization supports will also affect the partition co-efficient and thus affecting the kinetics of the enzyme.
6. Effectiveness factor is given by __________
a) ƞ=\(\frac{V}{V_free}\)
b) \(D_a=\frac{V_{max}}{K_L [S_b]}\)
c) \(K_m^{app}\) = Kmλ
d) λ=\(\frac{[C_0^{n+}]}{[C^{n+}]} = \frac{[A^{n-}]}{[A_0^{n-}]}\)
View Answer
Explanation: The rate of a reaction catalyzed by an immobilized enzyme (V) is normally lower than the rate due to the same amount of free enzyme in solution (Vfree). The change in rate of the reaction can be quantitatively expressed by introducing the effectiveness factor which is given by ƞ=\(\frac{V}{V_free}\). The effectiveness factor generally lies between 0 and 1 and is dependent on the bulk substrate concentration. It may be greater than unity because of partition or inhibitory effects or if the immobilized enzyme is stabilized relative to free enzyme over a period of time.
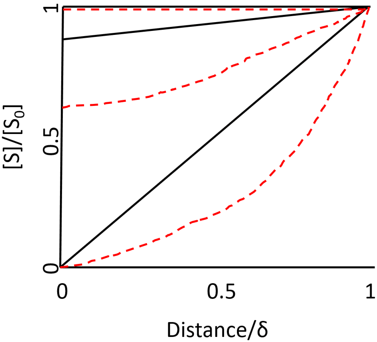
7. Which concentration profile of substrate molecules approaching the curved surface of immobilized enzymes is shown in the graph below?
a) Enzymes attached to spherical particles
b) Enzymes attached to the outside of the cylindrical fiber
c) Enzyme attached to the inside of the cylindrical fiber
d) Free enzymes
View Answer
Explanation: The concentration profile of flat surfaces is perfectly linear. The unusual ones are the curved surfaces such as spherical particles, the inside of cylindrical tubes or the outside of cylindrical fibers which produce non-linear concentration profiles. This is because of the substrate molecules approaching the surface through different pathways like convergent or divergent in nature. Hence the above concertation profile represents the enzyme attached to the inside of the cylindrical fiber. The black line represents r/ƍ = 9 and red dotted line represents r/ƍ = 0.11. Also, µ = 10-3, 1 and 103 for the top, middle and bottom pair of curves, respectively.
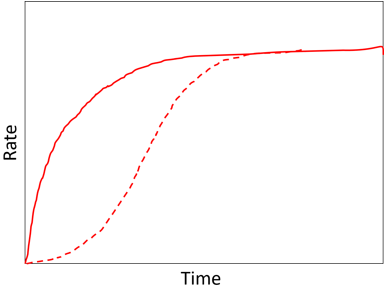
8. What does the following graph represent?
a) Effect of co-immobilization
b) Arrhenius plots
c) Effect pf pH
d) Concentration profile
View Answer
Explanation: The above graph represents the effect of co-immobilization on the rate of production through a short reaction pathway. The red line represents the enzymes in free solution whereas the red dotted line represents the co-immobilized enzymes showing a much reduced lag phase. When there are more enzymes in the pathway, reduction in lag phase is very much seen. In case, where the pathway is controlled by the initial substrate concentration which cannot be higher than the bulk concentration. But all those intermediates may be raised due to diffusional restriction on their rate of efflux. Arrhenius plots are related temperature and rate of reaction. Effect of pH against rate of reaction always gives a bell-shaped curve. Concentration profile comes into picture when the enzymes are immobilized on spherical surfaces.
9. What does the following graph predict?

a) Arrhenius plot
b) Activity versus pH
c) Substrate concentration versus effectiveness factor
d) Miachelis Menten plot
View Answer
Explanation: The plot in the above figure predicts the variation in substrate concentration in the center of the immobilized enzymes with effectiveness factor. Values of β (representing SR/Km) of 10, 1 and 10-3 are illustrated. At high effectiveness factor, the substrate concentration drops significantly towards the center of the particles. Whereas at low effectiveness factor, the substrate concertation drop is so severe that the centers of the particles encounter very little substrate. Variation in temperature and activity is given by Arrhenius plots. Activity versus pH always gives a bell-shaped curve. Miachelis Menten plot is a plot which gives hyperbolic curve.
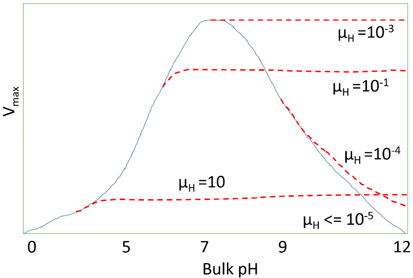
10. What does the following graph predicts?
a) The effect of diffusional control on the local pH
b) The effect of diffusional control on pH activity profile of an immobilized enzyme
c) Effect of substrate inhibition
d) Arrhenius plot
View Answer
Explanation: The above graph predicts the effect of diffusional control on pH activity profile of an immobilized enzyme. This graph shows the effect on surface on the pH activity profile. The proton modulus (µH) and the pH activity profile varies with flowrate and degree of turbulence. If the reaction is started at pH = 10 and µH = 0.1, the rate of hydrogen ion production is initially low, but its faster than the rate of diffusion of hydrogen ions. Due to which, there is a drop in the micro-environmental pH towards the optimal pH, increasing the rate of reaction. This process continues until the rate of diffusion equals the rate of reaction.
Sanfoundry Global Education & Learning Series – Enzyme Technology.
To practice all areas of Enzyme Technology, here is complete set of 1000+ Multiple Choice Questions and Answers.
If you find a mistake in question / option / answer, kindly take a screenshot and email to [email protected]
- Check Biotechnology Books
- Apply for Chemical Engineering Internship
- Practice Chemical Engineering MCQs
- Check Chemical Engineering Books
- Check Enzyme Technology Books
