This set of Enzyme Technology Multiple Choice Questions & Answers focuses on “Kinetics of Immobilized Enzymes – 2”.
1. Immobilization can greatly affect the stability of the enzyme.
a) True
b) False
View Answer
Explanation: The above statement is true. Immobilization can greatly affect the stability of the enzyme due to the following reasons:
Immobilization protocol may produce some strain on the enzyme which may lead to inactivation of the enzymes under denaturing condition conditions of pH and temperature.
As there is a substantial multipoint binding between the enzyme and the support, there is good amount of stabilization.
Immobilization also protects the enzyme from microbial attack, thus enhancing stability.
Enzyme and support must be complimentary with the formation of unstrained covalent and non-covalent interactions.
2. The ratio of volume of solution contained within the particle to the total volume of the particle is referred to as ____________
a) tortuosity
b) porosity
c) Km
d) catalytic efficiency
View Answer
Explanation: The ratio of volume of solution contained within the particle to the total volume of the particle is referred to as porosity. Tortuosity is the average ratio of path length between any points within the particle to their absolute distance apart. Km is defined as the substrate concentration at which the reaction rate is reduced to half. Catalytic efficiency is Kcat/Km.
3. What does the equation, λ=\(\frac{[C_0^{n+}]}{[C^{n+}]}=\frac{[A^{n-}]}{[A_0^{n-}]}\) represent?
a) Turnover number
b) Catalytic efficiency
c) Electrostatic potential coefficient
d) Porosity
View Answer
Explanation: The electrostatic potential coefficient is given by λ=\(\frac{[C_0^{n+}]}{[C^{n+}]}=\frac{[A^{n-}]}{[A_0^{n-}]}\) where,
\(C_0^{n+}\) and \(A_0^{n-}\) ae concentration of anions and cations in bulk environment
Cn+ and An- are concentration of anions and cations in microenvironment
For positively charged enzyme surface, the value of λ should be greater than 1 and negatively charged the value should be less than 1. The effect of partition on positively and negatively charged particles is equal and opposite. Kcat is referred to as turn over number that denotes the number of catalytic turn over events that happens per unit time. Kcat/ Km is termed as catalytic efficiency. Porosity is referred to as the ratio of volume of solution contained within the particle to the total volume of the particle.
4. Which of the following equation is true for \(K_m^{app}\), when the substrates are negatively charged?
a) Kcat/Km
b) Km/λ
c) Kmλ
d) Vmax/2
View Answer
Explanation: \(K_m^{app}\) = Km/λ for negatively charged substrates. \(K_m^{app}\) is found to be less than Km when the concentration of substrate in the vicinity of the enzyme active site is more than that in bulk solution. This is because Km is maximum at lower bulk concentration. Kcat/Km is the catalytic efficiency. Kmλ is the \(K_m^{app}\) for positively charged substrates. Km is the substrates concentration at which Vmax is reduced to half.
5. Immobilized enzymes observe diffusional resistance at different levels.
a) True
b) False
View Answer
Explanation: In the reaction catalyzed by immobilized enzymes, the substrates diffuses through the solutions to the catalytic active sites and products diffuse away in the bulk solutions. This diffusion is due to the concentration gradient created as solutes move in direction of higher to lower concentration. At different levels in immobilized enzymes observe diffusional resistance. This resistance may vary depending on
The nature of support material
Hydro-dynamical conditions surrounding the support material
Distribution of enzyme inside/ on the surface of the support material.
Hence the above statement is true.
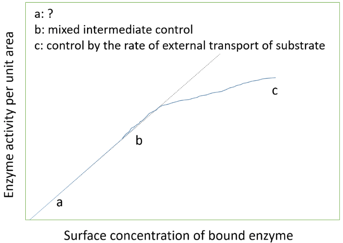
6. What does ‘a’ represent in the following graph?
a) Effectiveness factor
b) Catalytic efficiency
c) Kinetic control by the enzyme
d) Damkohler number
View Answer
Explanation: The above graph shows variation in the rate of the reaction catalyzed by immobilized enzyme with its concentration. The relation shows 3 phases:
Kinetic control by enzyme which is extrapolated to show the activity of equivalent amount of free enzyme.
Mixed intermediate control.
Control by the rate of external transport of substrate.
The point ‘a’ in the graph represents kinetic control by enzymes. Damkohler number is the ratio of maximum rate of reaction to the maximum rate of diffusion. Effectiveness factor is given the ratio of rate of reaction catalyzed by immobilized enzymes to rate of the reaction catalyzed by free enzymes. Catalytic efficiency is given by Kcat/Km.
7. In case of immobilized enzymes, what type of inhibition is represented by the following equation?
\(V=\frac{V_{max} S}{K_m+\frac{K_m [S_0]K_L^s}{K_p K_l^p}}\)
a) Substrate
b) Product
c) Uncompetitive
d) Competitive
View Answer
Explanation: The equation, V=\(\frac{V_{max} S}{K_m+\frac{K_m [S_0]K_L^s}{K_p K_l^p}}\) represents the equation for product inhibition in case of immobilized enzymes.
Vmax = max rate of reaction, S = Substrate concentration, S0 = initial substrate concentration, Km = Miachelis Menten constant, \(K_L^s\) = Substrate mass transfer co-efficient, \(K_l^p\) = Product mass transfer co-efficient and Kp = Product inhibitory constant.
The effect of product inhibition depends on the bulk substrate concentration. The ratio \(\frac{K_m [S_0]K_L^s}{K_p K_l^p}\) expresses the competition between the substrate and the product at surface of the enzyme. This ratio increases with increase in the product, causing reduction in rate of the reaction and effectiveness factor.
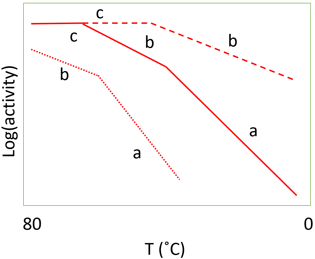
8. The plot in the following diagram are referred to as _______________
a) concentration profile
b) pH profile
c) arrhenius plot
d) hanes plot
View Answer
Explanation: The plot in the diagram is a graph of log activity versus temperature and is referred to as Arrhenius plot. This plot shows the progressive effect of diffusional limitations on the rate of the reaction catalyzed by porous particles containing immobilized enzymes. As the temperature increase, the activity progresses in 3 phases
Point ‘a’ representing enzyme kinetic control.
Point ‘b’ representing control of the reaction rate by the internal diffusion of the substrate.
Point ‘c’ representing the control of the reaction rate by the diffusion of the substrate to the surface.
In the plot,
………………. low enzyme loading
____________ intermediate enzyme loading
__ __ __ __ __ high enzyme loading
An Arrhenius plot using real data for an immobilized enzyme would show pronounced curvature between the three phases. The transition between the linear sections would not be readily discernible, over the range of temperatures normally encountered for the use of immobilized enzymes, unless the standard free energy of activation for the reaction was unusually high.
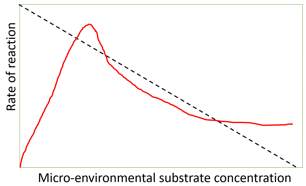
9. What does the graph predict?
a) Effect of pH on activity of enzyme
b) Effect of substrate inhibition
c) Effect of temperature on activity on enzyme
d) Arrhenius plot
View Answer
Explanation: The graph predicts the effect of substrate inhibition on the rate of immobilized enzymes. The red line indicates immobilized enzymes versus micro-environmental substrate concentration. The black dotted line indicates the rate of diffusion of substrate from the bulk to the micro-environment. The micro-environmental substrate concentration which relatively lower to the bulk concentration gives the higher rate of reaction. Effect of pH and temperature is usually represented by a bell-shaped curve. Arrhenius plots involve temperature on x-axis and rate of reaction on y-axis.
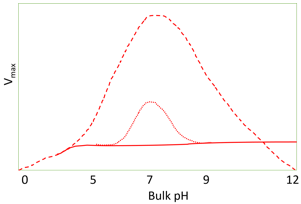
10. What does the diagram represent?
a) The effect of facilitated transport of hydrogen ions
b) Effect of substrate inhibition
c) The effect of diffusional control on pH activity profile of an immobilized enzyme
d) The effect of diffusional control on the local pH
View Answer
Explanation: The diagram represents the effect of facilitated transport of hydrogen ions on pH activity profile (under conditions µ = 10). The buffer is only effective for facilitating transport at a value close to its pKa as at low pH there is less amount base present which can bind to the hydrogen ions. At high pH, there is very little binding to hydrogen ions due to the unfavorable equilibria. At a bulk pH of 7 about a thousand times more hydrogen ions are transported by a mM buffer with a pKa of 7 than as free hydrogen ion. The presence of these buffering ions can significantly affect the pH– activity profile of reactions limited by hydrogen ion diffusion.
Sanfoundry Global Education & Learning Series – Enzyme Technology.
To practice all areas of Enzyme Technology, here is complete set of 1000+ Multiple Choice Questions and Answers.
If you find a mistake in question / option / answer, kindly take a screenshot and email to [email protected]
- Apply for Chemical Engineering Internship
- Check Chemical Engineering Books
- Check Biotechnology Books
- Practice Chemical Engineering MCQs
- Check Enzyme Technology Books
