This set of Digital Image Processing online test focuses on “Spatial and Gray-Level Resolution and Aliasing”.
1. The principal factor to determine the spatial resolution of an image is _______
a) Quantization
b) Sampling
c) Contrast
d) Dynamic range
View Answer
Explanation: The spatial resolution of an image principally determine by Sampling.
2. What causes the effect, imperceptible set of very fine ridge like structures in areas of smooth gray levels?
a) Caused by the use of an insufficient number of gray levels in smooth areas of a digital image
b) Caused by the use of huge number of gray levels in smooth areas of a digital image
c) All of the mentioned
d) None of the mentioned
View Answer
Explanation: The set of very fine ridge like structures in area of smooth gray levels generally is quite visible in images displayed using 16 or less uniformly spaced gray levels.
3. What is the name of the effect caused by the use of an insufficient number of gray levels in smooth areas of a digital image?
a) Dynamic range
b) Ridging
c) Graininess
d) False contouring
View Answer
Explanation: The effect, caused due to insufficient number of gray levels in smooth areas of a digital image, is called false contouring, so called because the ridges resemble topographic contours in a map.
4. Using rough rule of thumb, and assuming powers of 2 for convenience, what image size are about the smallest images that can be expected to be reasonably free of objectionable sampling checkerboards and false contouring?
a) 512*512pixels and 16 gray levels
b) 256*256pixels and 64 gray levels
c) 64*64pixels and 16 gray levels
d) 32*32pixels and 32 gray levels
View Answer
Explanation: An image of 128*128pixels shows a pronounced checkerboard pattern, while for 256*256pixels image a minimum gray level of 64 is required to remove false contouring.
Also the effect is quite visible in images displayed using 16 or less uniformly spaced gray levels.
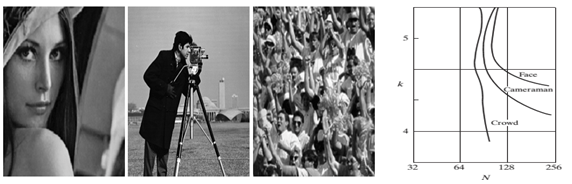
5. What does a shift up and right in the curves of isopreference curve simply means? Verify in terms of N (number of pixels) and k (L=2k, L is the gray level) values.
a) Smaller values for N and k, implies a better picture quality
b) Larger values for N and k, implies low picture quality
c) Larger values for N and k, implies better picture quality
d) Smaller values for N and k, implies low picture quality
View Answer
Explanation: Points lying on an isopreference curve correspond to images of equal subjective quality. It was found that the isopreference curves tended to shift right and upward with the details of the image. So, a shift up and right in the curves simply means larger values for N and k, implying better picture quality.
6. How does the curves behave to the detail in the image in isopreference curve?
a) Curves tend to become more vertical as the detail in the image decreases
b) Curves tend to become less vertical as the detail in the image increases
c) Curves tend to become less vertical as the detail in the image decreases
d) Curves tend to become more vertical as the detail in the image increases
View Answer
Explanation: The curves in isopreference curve tend to become more vertical as the detail in the image increases.
The right side graph shows the same, curve for crowd is nearly vertical.
7. For an image with a large amount of detail, if the value of N (number of pixels) is fixed then what is the gray level dependency in the perceived quality of this type of image?
a) Totally independent of the number of gray levels used
b) Nearly independent of the number of gray levels used
c) Highly dependent of the number of gray levels used
d) None of the mentioned
View Answer
Explanation: For image with high details of the image only a few gray levels may be needed.
8. What is a band-limited function?
a) A function of limited duration whose highest frequency is finite
b) A function of limited duration whose highest frequency is infinite
c) All of the mentioned
d) None of the mentioned
View Answer
Explanation: Functions whose area under the curve is finite can be represented in terms of sines and cosines of various frequencies. The highest frequency is determined by the sine/cosine component is the highest “frequency content” of the function. If this highest frequency is finite and that the function is of unlimited duration, then, these functions are called band-limited functions.
9. For a band-limited function, which Theorem says that “if the function is sampled at a rate equal to or greater than twice its highest frequency, the original function can be recovered from its samples”?
a) Band-limitation theorem
b) Aliasing frequency theorem
c) Shannon sampling theorem
d) None of the mentioned
View Answer
Explanation: For a band-limited function, Shannon sampling theorem says that “if the function is sampled at a rate equal to or greater than twice its highest frequency, the original function can be recovered from its samples”.
10. What is the name of the phenomenon that corrupts the sampled image, and how does it happen?
a) Shannon sampling, if the band-limited functions are undersampled
b) Shannon sampling, if the band-limited functions are oversampled
c) Aliasing, if the band-limited functions are undersampled
d) Aliasing, if the band-limited functions are oversampled
View Answer
Explanation: If the band-limited functions is undersampled, then a phenomenon called aliasing corrupts the sampled image.
11. How aliasing does corrupts the sampled image?
a) By introducing additional frequency components to the sampled function
b) By removing some frequency components from the sampled function
c) All of the mentioned
d) None of the mentioned
View Answer
Explanation: Aliasing corrupts the sampled image by introducing additional frequency components into the sampled function. These added components are called aliased frequencies.
12. How can one reduce the aliasing effect on an image?
a) By reducing the high-frequency components of image by blurring the image
b) By increasing the high-frequency components of image by blurring the image
c) By reducing the high-frequency components of image by clarifying the image
d) By increasing the high-frequency components of image by clarifying the image
View Answer
Explanation: Aliasing corrupts the sampled image by introducing additional frequency components to the sampled function. So, the principal approach for reducing the aliasing effects on an image is to reduce its high-frequency components by blurring the image prior to sampling.
Sanfoundry Global Education & Learning Series – Digital Image Processing.
To practice all areas of Digital Image Processing for online tests, here is complete set of 1000+ Multiple Choice Questions and Answers.
If you find a mistake in question / option / answer, kindly take a screenshot and email to [email protected]
- Check Electronics Engineering Books
- Check Digital Image Processing Books
- Apply for Electrical Engineering Internship
- Practice Electrical Engineering MCQs
- Check Electrical Engineering Books
