This set of Data Science Multiple Choice Questions & Answers (MCQs) focuses on “Exploratory Graphs”.
1. Which of the following graphs has properties in the below figure?
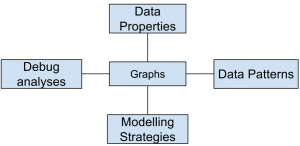
a) Exploratory
b) Inferential
c) Causal
d) None of the mentioned
View Answer
Explanation: Making plots of the data reveals various interesting features.
2. Which of the following dimension type graph is shown in the below figure?
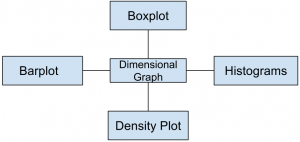
a) one-dimensional
b) two-dimensional
c) three-dimensional
d) none of the mentioned
View Answer
Explanation: A two-dimensional graph is a set of points in two-dimensional space.
3. Which of the following gave rise to need of graphs in data analysis?
a) Data visualization
b) Communicating results
c) Decision making
d) All of the mentioned
View Answer
Explanation: A picture can tell better story than data.
4. Which of the following is characteristic of exploratory graph?
a) Made slowly
b) Axes are not cleaned up
c) Color is used for personal information
d) All of the mentioned
View Answer
Explanation: A large number of exploratory graphs are made.
5. Point out the correct statement.
a) coplots are one dimensional data graph
b) Exploratory graphs are made quickly
c) Exploratory graphs are made relatively less in number
d) All of the mentioned
View Answer
Explanation: coplot is used for two dimensional representation.
6. Which of the following graph can be used for simple summarization of data?
a) Scatterplot
b) Overlaying
c) Barplot
d) All of the mentioned
View Answer
Explanation: A bar chart or bar graph is a chart that presents Grouped data with rectangular bars with lengths proportional to the values that they represent.
7. Color and shape are used to add dimensions to graph data.
a) True
b) False
View Answer
Explanation: Graphs are commonly used by print and electronic media.
8. Which of the following information is not given by five-number summary?
a) Mean
b) Median
c) Mode
d) All of the mentioned
View Answer
Explanation: The mode is the value that appears most often in a set of data.
9. Which of the following is also referred to as overlayed 1D plot?
a) lattice
b) barplot
c) gplot
d) all of the mentioned
View Answer
Explanation: lattice is an add-on package that implements Trellis graphics.
10. Spinning plots can be used for two dimensional data.
a) True
b) False
View Answer
Explanation: There are many ways to create a 3D spinning plot as well.
Sanfoundry Global Education & Learning Series – Data Science.
Here’s the list of Best Books in Data Science.
- Check Computer Science Books
- Practice Programming MCQs
- Practice Computer Science MCQs
- Check Data Science Books
- Check Programming Books
