This set of Bioprocess Engineering Multiple Choice Questions & Answers (MCQs) focuses on “Data Analysis”.
1. Which type of graph plot is used to analyze the effect of temperature on the rates of chemical reactions?
a) Dot plot
b) Normal probability plot
c) Arrhenius plot
d) Line weaver-Burk plot
View Answer
Explanation: An Arrhenius plot displays the logarithm of kinetic constants (ln (k), ordinate axis) plotted against inverse temperature (1/T, abscissa). The Arrhenius equation can be written as:
ln (k) = ln (A) – (Ea/R) (1/T)
Where :
k = Rate constant
A = Pre-exponential factor
Ea = Activation energy
R = Gas constant
T = Absolute temperature, K
In the right, which represents the y-coordinate axis.
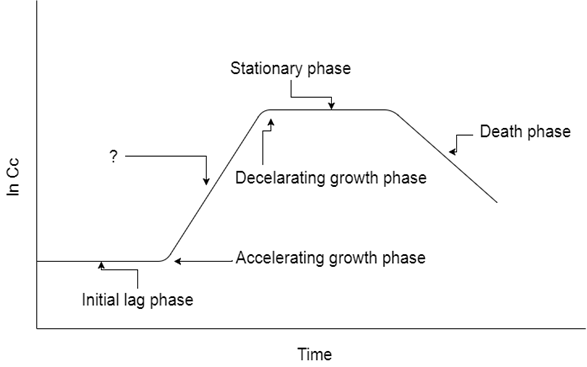
2. From the below representation of growth phase, which is the missing growth phase?
a) Exponential Growth Phase
b) Final Lag Phase
c) Initial Log Phase
d) Final Log phase
View Answer
Explanation: The Log/ Exponential Growth phase is a period characterized by cell doubling. If growth is not limited, doubling will continue at a constant rate so both the number of cells and the rate of population increase doubles with each consecutive time period. For this type of exponential growth, plotting the natural logarithm of cell number against time produces a straight line.
3. If the substrate is given in molar concentration how would you define it’s Molarity and Molality based on the temperature condition?
a) Molarity and Molality both will change on effect of temperature
b) Molarity will change but not Molality
c) Molality will change but not Molarity
d) Normality of the reaction will change
View Answer
Explanation: Molarity is the number of moles of solute per kilogram of the Solvent. That is because molarity does not depend on temperature, (neither on number of moles of solute nor mass of solvent will be affected by changes of temperature). While molarity changes as temperature changes because molarity is affected by temperature. This is because it is based on the volume of the solution, and the volume of a substance will be affected by changes in temperature.
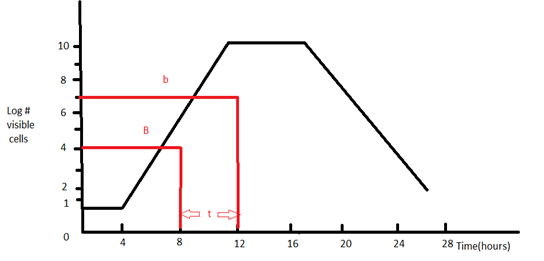
4. What is the generation time of a bacterial population that increases from 10,000 cells to 10,000,000 cells in four hours of growth?
a) 24 minutes
b) 30 minutes
c) 34 minutes
d) 60 minutes
View Answer
Explanation: The generation time is the time interval required for the cells (or population) to divide.
G (generation time) = (time, in minutes or hours)/n(number of generations)
G = t/n
t = time interval in hours or minutes
B = number of bacteria at the beginning of a time interval
b = number of bacteria at the end of the time interval
n = number of generations (number of times the cell population doubles during the time interval)
b = B x 2n (This equation is an expression of growth by binary fission)
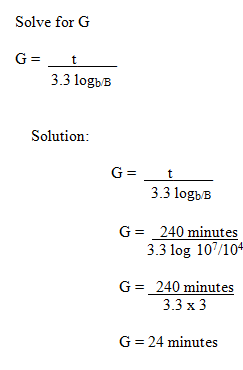
Solve for n:
Logb = logB + nlog2
n = \(\frac{log_b – log_B}{log2}\)
n = \(\frac{log_b – log_B}{.301}\)
n = 3.3 logb/B
G = t/n
5. On which type of plot the best fit line is represented?
a) Dot plot
b) Line weaver- Burk plot
c) Scatter plot
d) Bland- Altman plot
View Answer
Explanation: A line of best fit is a straight line drawn through the center of a group of data points plotted on a scatter plot. Scatter plots depict the results of gathering data on two variables. The line of best fit shows whether these two variables appear to be correlated and can be used to help identify trends occurring within the dataset. Analysts may use the line of best fit when determining a relationship between two variables where one variable is independent and one variable is being examined for dependency.
6. In the case of Rota meter, which is used for measuring the water flow rate?
a) Only one variable is involved, i.e. independent variable (the Rota meter reading)
b) Only two variables are involved: one independent variable(the Rota meter reading) and one dependent variable (the water flow rate)
c) Only two variables are involved: one independent variable(the water flow rate) and one dependent variable (the Rota meter reading)
d) Only one variable is involved, i.e. independent variable (the water flow rate)
View Answer
Explanation: Rota meter is a device which measures flow rate. This is done by allowing the cross-sectional area the fluid travels through to vary, causing a measurable effect, i.e. water flow rate is dependent on Rota meter.
7. The diauxic growth curve mainly found in E.coli in the case of two types of nutrients is found in Batch culture is based on which equation?
a) Monod equation
b) Michaelis – Menten equation
c) Schrodinger equation
d) Lyapunov equation
View Answer
Explanation: Jacques Monod discovered diauxic growth in 1941 during his experiments with Escherichia coli and Bacillus subtilis. While growing these bacteria on various combinations of sugars during his doctoral thesis research, Monod observed that often two distinct growth phases are clearly visible in batch culture.
8. Essentially in an experiment involving bacteria, we measure Optical density of the media where the bacteria grow at different time point from the same flask. If we have 2 or more types of bacteria and want to investigate whether the growth curve of those bacteria are significantly different, what do you think the best analysis can be applied for this purpose?
a) Linear regression analysis or general regression analysis
b) Non- linear regression analysis or general regression analysis
c) Logistic regression analysis
d) Stepwise regression analysis
View Answer
Explanation: If the growth rates fit a polynomial curve, you can use General Regression and enter the bacteria type as categorical variable. Otherwise, you may need to use nonlinear regression separately for each type.
9. What is the basic Optical Density (O.D) of the bacterial cells?
a) 680nm
b) 600nm
c) 200nm
d) 280nm
View Answer
Explanation: 600nm is a wavelength of light that is minimally absorbed by material within cells. Therefore, they can be more reliably used than other wavelengths (in most common situations). To simply, measure the scattering of light due to turbidity (just general presence of particles in a solution).
10. For what MANOVA is used for?
a) Detection of biological samples
b) Detection of the best fit curve
c) Comparison between monovariate samples
d) Comparison between multivariate samples
View Answer
Explanation: In statistics, multivariate analysis of variance (MANOVA) is a procedure for comparing multivariate sample means. As a multivariate procedure, it is used when there are two or more dependent variables and is typically followed by significance tests involving individual dependent variables separately.
Sanfoundry Global Education & Learning Series – Bioprocess Engineering.
To practice all areas of Bioprocess Engineering, here is complete set of 1000+ Multiple Choice Questions and Answers.
If you find a mistake in question / option / answer, kindly take a screenshot and email to [email protected]
- Check Biotechnology Books
- Check Bioprocess Engineering Books
- Apply for Biotechnology Internship
- Practice Biotechnology MCQs
