This set of Class 12 Biology Chapter 13 Multiple Choice Questions & Answers (MCQs) focuses on “Growth Models – 2”.
1. Which of the following is a S-shaped growth curve?
a) Exponential growth
b) Logistic growth curve
c) J-shaped curve
d) Geometric curve
View Answer
Explanation: The logistic growth curve is also known as the sigmoid / S-shaped growth curve. It is considered to be a realistic curve. It is obtained due to the finite and limited source of resources in a population. It is also called a Verhulst-Pearl Logistic Growth curve.
2. Which shape does the exponential growth curve show?
a) J-shape
b) U-shape
c) W-shape
d) M-shape
View Answer
Explanation: An exponential growth is observed when resources in the population are unlimited. The population grows in geometric fashion and results in a J-shaped curve.
3. In which phase is the stationary phase absent?
a) Sigmoidal growth
b) Exponential growth
c) Decreasing growth
d) Deacceleration growth
View Answer
Explanation: The stationary phase is absent in exponential growth. Exponential growth is observed when resources in the population are unlimited. The population grows in geometric fashion and results in a J-shaped curve.
4. In which growth the environmental resistance suddenly occurs?
a) Logistic growth
b) Sigmoidal growth
c) S-shaped growth curve
d) Exponential growth
View Answer
Explanation: The environmental resistance suddenly occurs in exponential growth. In this, there is no stationary phase and population density shows a sudden crash due to environmental resistance.
5. In which curve the population density shows a sudden crash?
a) M-shaped
b) N-shaped
c) J-shaped
d) S-shaped
View Answer
Explanation: The population density shows a sudden crash in the J-shaped curve. In this, there is no stationary phase and the environmental resistance operates.
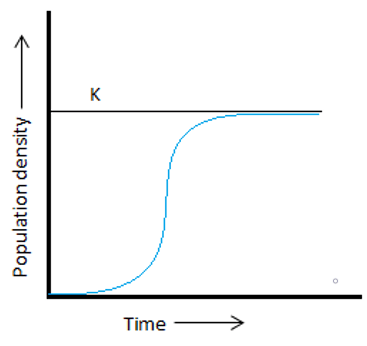
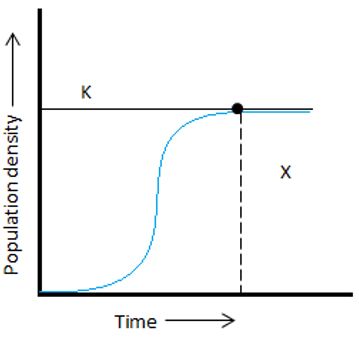
6. What does the blue line in the given figure indicate?
a) Decreasing growth
b) Sigmoidal growth
c) Exponential growth
d) J-shaped
View Answer
Explanation: The given figure is of sigmoidal growth. It is a logistic/ S-shaped growth curve. It is obtained due to the finite and limited source of resources in a population.
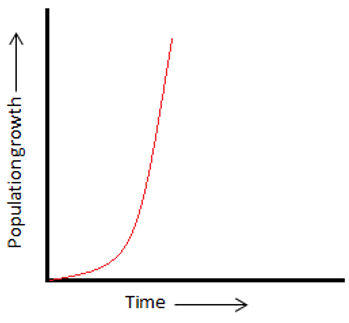
7. What does the red line in the given figure indicate?
a) Sigmoidal growth
b) S-shaped growth curve
c) Logistic growth
d) Exponential growth
View Answer
Explanation: The given figure is of exponential growth. The exponential growth is in which the population continues to multiply in a geometric fashion. It results in a J-shaped curve. It is obtained when the resources in the population are unlimited.
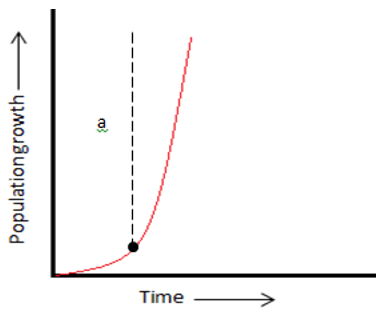
8. Which phase does ‘a’ in the given figure of the exponential curve indicate?
a) Exponential phase
b) Stationary phase
c) Lag phase
d) Deacceleration phase
View Answer
Explanation: It indicates a lag phase. The lag phase is the initial phase of a growth curve in which the population increases slowly. In this phase, the population tries to adopt the new environment.
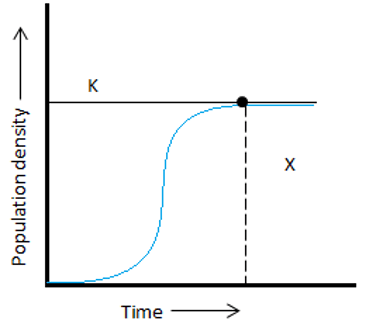
9. Which phase does ‘X’ in the given figure of the sigmoidal curve indicate?
a) Carrying capacity
b) Log phase
c) Lag phase
d) Stationary phase
View Answer
Explanation: It indicates a stationary phase. The population achieves zero growth in the stationary phase. It is the last phase of logistic growth. It is due to many reasons such as exhaustion of resources, aging, etc.
10. What does ‘K’ in the given figure of the sigmoidal curve indicate?
a) Lag phase
b) Log phase
c) Carrying capacity
d) Stationary phase
View Answer
Explanation: The carrying capacity of a population is designated by the letter ‘K’. The resources in a given habitat can be used by the maximum possible number of a population; beyond this, no further growth is seen in a population. This is known as the carrying capacity of that species in that habitat.
Sanfoundry Global Education & Learning Series – Biology – Class 12.
To practice all chapters and topics of class 12 Biology, here is complete set of 1000+ Multiple Choice Questions and Answers.
If you find a mistake in question / option / answer, kindly take a screenshot and email to [email protected]
- Practice Class 12 - Chemistry MCQs
- Check Class 12 - Biology Books
- Practice Class 11 - Biology MCQs
- Practice Class 12 - Physics MCQs
- Practice Class 12 - Mathematics MCQs
