This set of Environmental Engineering Multiple Choice Questions & Answers (MCQs) focuses on ” Oxygen Sag Curve”.
1. What is yellow curve represents in the following figure?
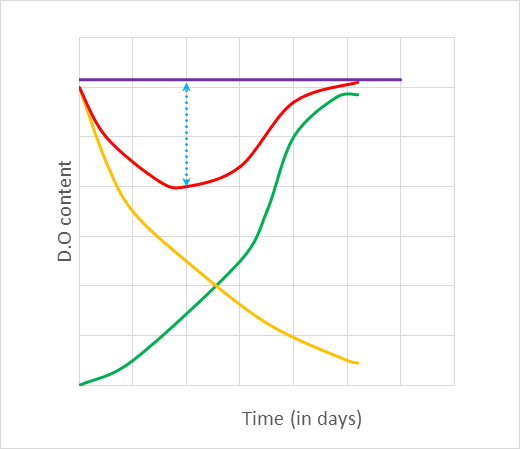
Figure: Oxygen sag curve
a) Deoxygenation curve
b) Reoxygenation curve
c) Oxygen sag curve
d) Equilibrium concentration of oxygen
View Answer
Explanation: The yellow curve represents the deoxygenation curve, which depicts the depletion of dissolved oxygen in the absence of aeration.
2. Which of the following is represented by the green curve in the following figure?
Figure: Oxygen sag curve
a) Deoxygenation curve
b) Reoxygenation curve
c) Oxygen sag curve
d) Equilibrium concentration of oxygen
View Answer
Explanation: The green curve represents the reoxygenation curve, which depicts the supply of oxygen from the atmosphere to counterbalance the oxygen deficit.
3. The maximum deficiency of dissolved oxygen is represented by ____________
Figure: Oxygen sag curve
a) Dotted blue line
b) Green curve
c) Yellow curve
d) Violet curve
View Answer
Explanation: The maximum deficiency of dissolved oxygen is represented by the dotted blue line. It is finding with respect to the equilibrium concentration of oxygen.
4. Which of the following represents the oxygen sag curve in the following figure?
Figure: Oxygen sag curve
a) Dotted blue line
b) Green curve
c) Yellow curve
d) Red curve
View Answer
Explanation: The oxygen sag curve is represented by the red curve. It is also called as an oxygen deficit curve.
5. The oxygen deficit is maximum when?
Figure: Oxygen sag curve
a) Rate of reaeration is 0
b) Rate of deoxygenation is 0
c) Rate of reaeration equals the rate of deoxygenation
d) Rate of reaeration > rate of deoxygenation
View Answer
Explanation: The rate of oxygen deficit is the sum of the rate of reaeration and the rate of deoxygenation and it is maximum when the rate of reaeration equals the rate of deoxygenation.
6. When the BOD of wastewater increases, then?
Figure: Oxygen sag curve
a) Rate of reaeration decreases
b) Rate of oxygen deficit increases
c) Rate of oxygen deficit decreases
d) Amount of oxygen in wastewater increases
View Answer
Explanation: When the BOD of wastewater increases, the amount of dissolved oxygen decreases, so the rate of oxygen deficit increases.
7. Rate of aeration is independent of the D.O content of wastewater.
Figure: Oxygen sag curve
a) True
b) False
View Answer
Explanation: Rate of aeration = -(Rate of dissolved oxygen in water) which implies that the rate of aeration increases with increase in reduction of dissolved oxygen from wastewater.
8. The reoxygenation constant at temperature ‘T’ is expressed by ___________
a) KRT = KR20 (1.016)T
b) KRT = KR20 (1.047) T-20
c) KRT = KR20 (1.016)T-20
d) KRT = KR20 (1.047)T
View Answer
Explanation: The reoxygenation constant at temperature ‘T’,
KRT = KR20 (1.016)T-20, where KR20 is the reoxygenation constant at 20oC.
Sanfoundry Global Education & Learning Series – Environmental Engineering.
To practice all areas of Environmental Engineering, here is complete set of 1000+ Multiple Choice Questions and Answers.
If you find a mistake in question / option / answer, kindly take a screenshot and email to [email protected]
- Practice Mining Engineering MCQs
- Check Mining Engineering Books
- Check Environmental Engineering Books
- Apply for 1st Year Engineering Internship
